Device Details
The Device Details view contains a series of sub-views that present Device centric transactional or location data. These views provide in-depth historical information that assists in troubleshooting Device behavior.
 Transactions: Display LoRa transactional events for the Device.
 Map: Displays the current location of a Device on a map.
 RF Statistics: Display RF information for the Device in heatmap form.
 Statistics: Display key LoRa transactional statistics for a Device.
Click on a Device EUI to open the Device Details view.
Device Transactions
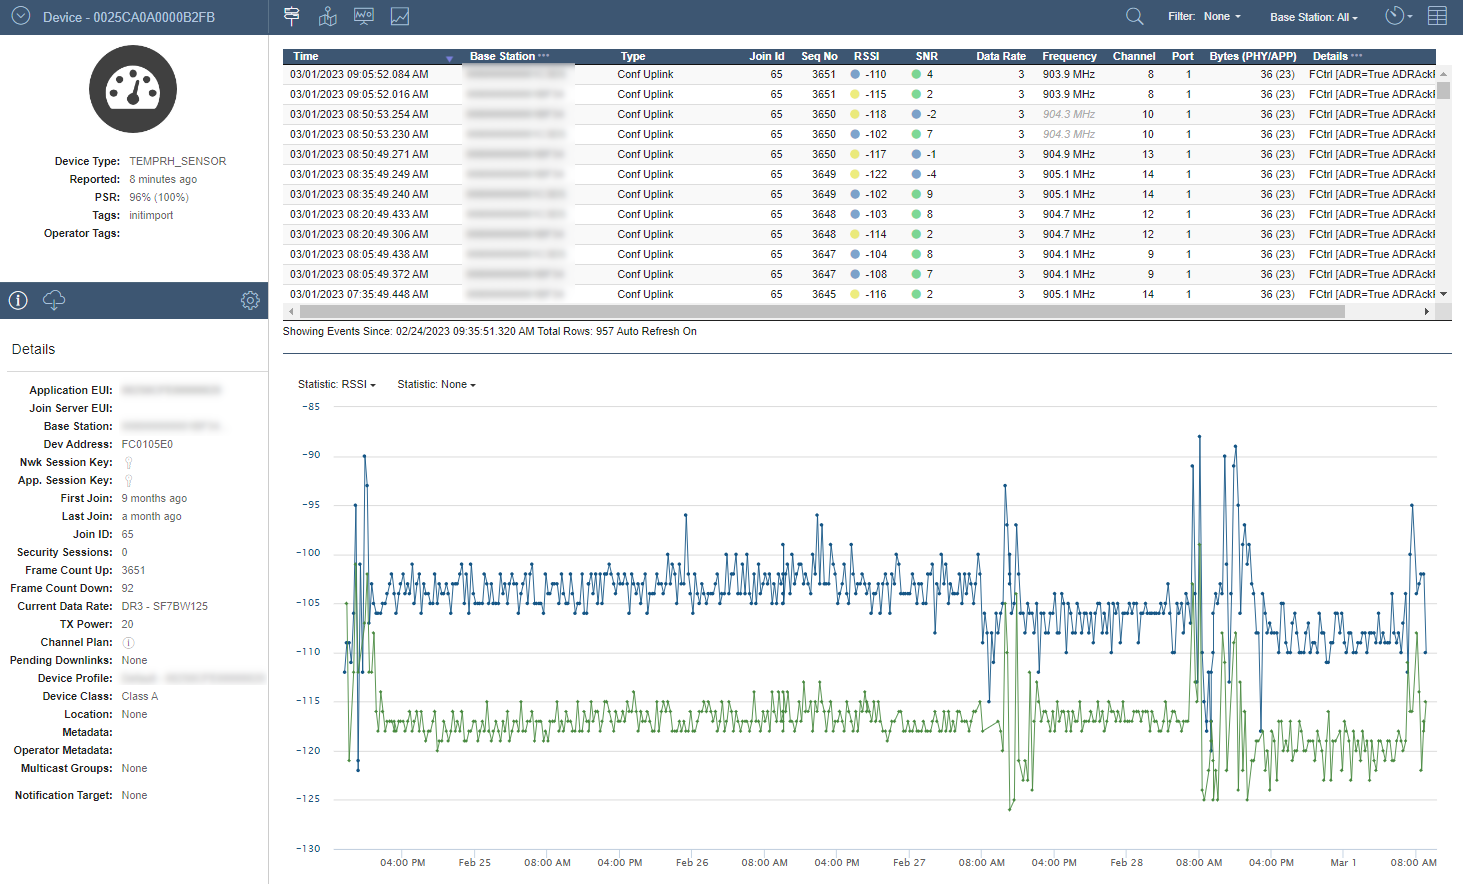
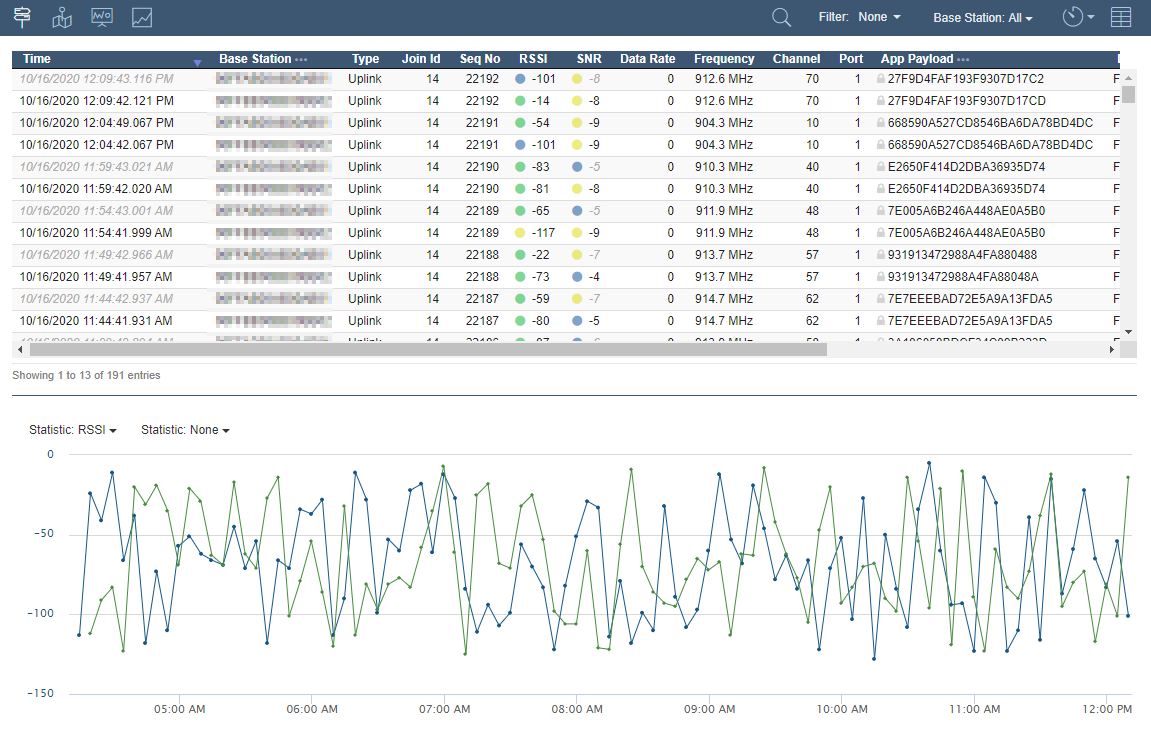
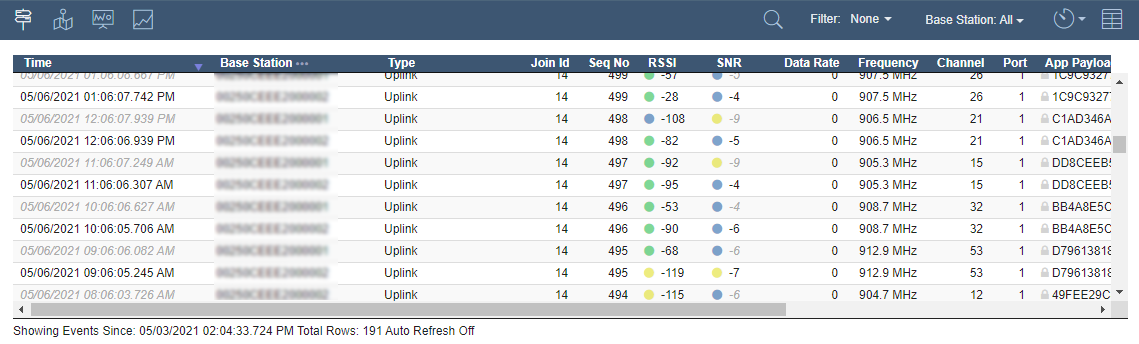
The Device Details Transactions view is a combined table and chart view that shows the communication events between the Device and the Network Server. The table shows the processed LoRa event data and the chart shows the statistics from those events over time. Events that are received late are specifically identified with light italicized text in the Time column.
The view can be filtered to specific event types or to communications involving specific Base Stations. The chart view will display the statistics from those filtered events and supports display of either one or two statistics at a time.
Helium Hotspot ID:
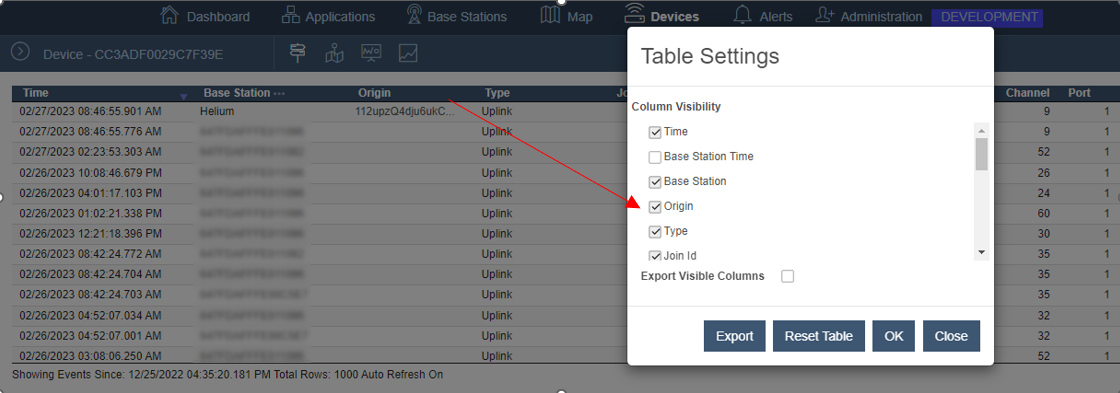
The Device Event View can display the Hotspot ID that heard a Device connected to the Helium Network. This is displayed in the optional "Origin" column that can be enabled in the Table Settings. This column is hidden by default.
Pre-defined Filters:
The Transactions view has several pre-defined filters to help troubleshoot LoRa network issues. These filters are only applied to events loaded into the view.
| Filter Name | Description |
|---|---|
| Unique Uplinks/Downlinks | Filters to events with "Uplink" in the Type column and where the sub-string "dup=true" is not in the Details column. Includes Downlinks associated with the Uplinks. |
| Unique Uplinks | Filters to events with "Uplink" in the Type column and where the sub-string "dup=true" is not in the Details column. Excludes Downlinks associated with the Uplinks. |
| Join Activity | Filters to events with "Join" in the Type column. |
| Application Downlinks | Filters to Unique Uplink events, events with "Downlink" in the Type column, events with data in the Encrypted or App PDU columns and events with "Ack=true" in the Details column |
| ADR Activity | Filters to events with "ADR Check" in the Type column or events with any of the following strings in the Details column: "LinkADRReq","LinkADRAns", or "ADRAckReq=True". |
| ADR Disabled | Filters to events with "ADR=False" |
| Uplinks | Filters to events with "Uplink" in the Type column. |
| Downlinks | Filters to events with "Downlink" in the Type column. |
| MAC Commands | Filters events with a MAC command string appearing anywhere in the Details column. |
Date/Time Filtering:
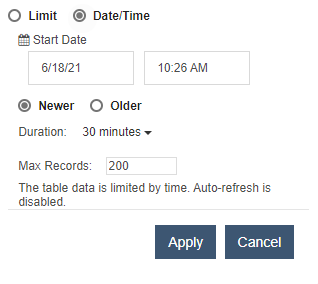
Events can be filtered to those that occurred at a specific point in time using the Date/Time filter. Click the  button to open the limit and Date/Time filtering options for the view.
The options popup has two modes, a row limiting mode and a Date/Time filter mode. The row limit mode is used to define the number of events that are returned from the server. Limiting the number of rows returned generally improves data processing performance.
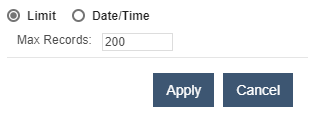
As noted, the Date/Time filtering mode is used to filter events to a specific point in time. Selecting a date and time, determines the starting point for the events that will be returned. The Duration value determines the maximum amount of time from the specified start time that events will be returned.
For example, starting at 7 a.m. with a duration of 1 hour will return events that occurred between 7 a.m. and 8 a.m if "Newer" is selected. Otherwise if "Older" is selected, events from 7 a.m. to 6 a.m. will be returned. Since the number of events that occur within a specified timeframe is variable, the Max Rows value is used to further limit the returned data.
Auto Refresh
By default, the Transactions view appends new events periodically every 30 seconds. This behavior is disabled when either a Date/Time filter is applied or the view is scrolled to a position other than the top of the table. Auto-refresh is re-enabled when either the view is refreshed or the view is scrolled back to the top.
An indication of the auto refresh status is displayed in the Transaction view's table footer as shown here:
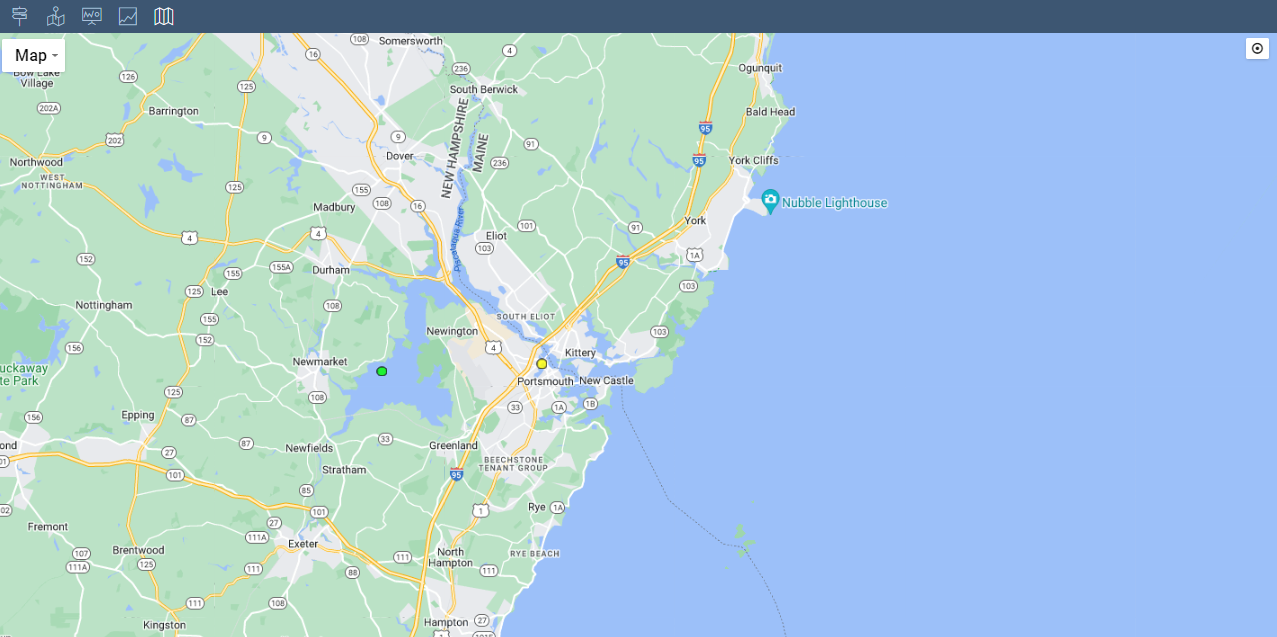
Device Map
The Device Details Map view provides a location context for the Device. The position of the Device may be actual or estimated depending on GPS support or activation of the estimated location feature. Historical positional data may also be available if the Device model includes that data when communicating with the Network Server. Like the main Map view, the Device Details Map view supports display of detailed Device information in the Map.
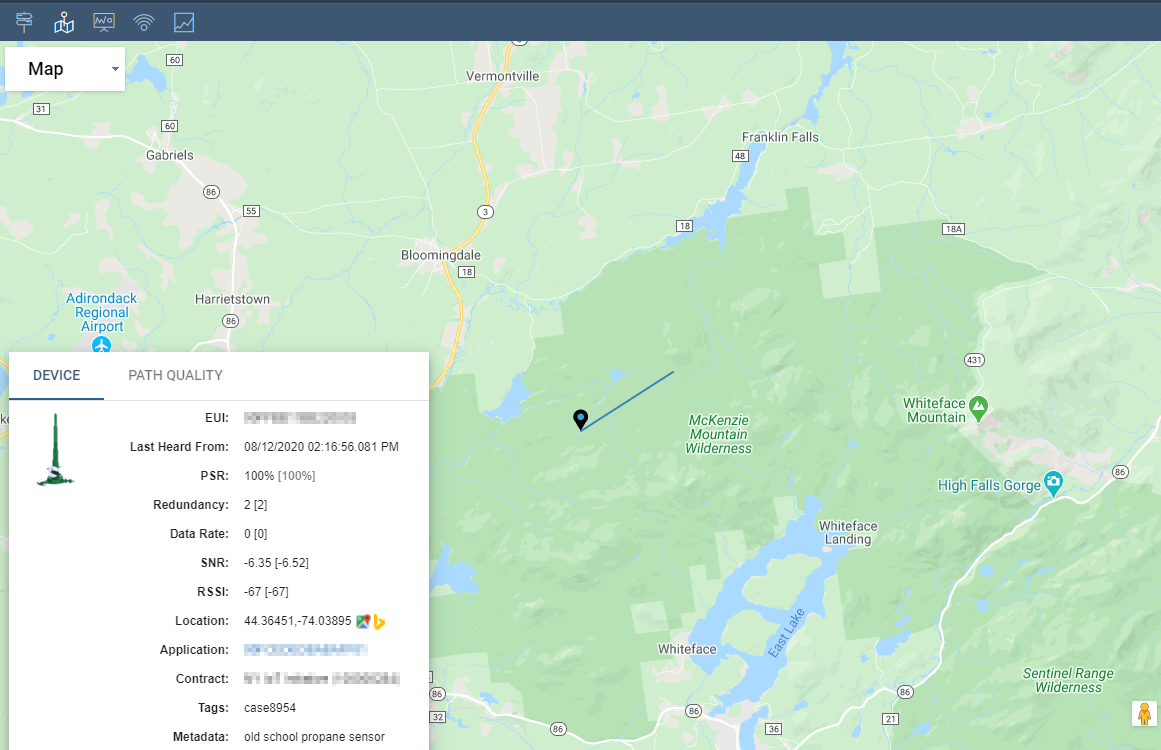
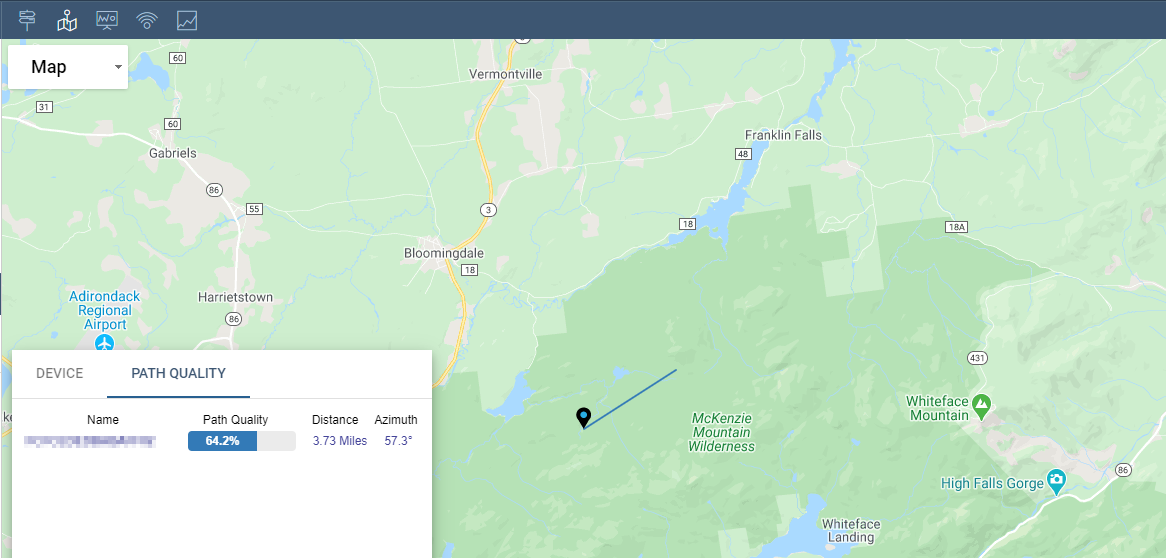
Path Quality information is also available:
Device RF Statistics
The RF Statistics view consists of three heatmap charts that show Uplink,SNR and RSSI statistics on a per-channel basis over time. The view supports daily or monthly aggregation of the data and supports navigation through time in 1 hour, 6 hour or 1 day increments.
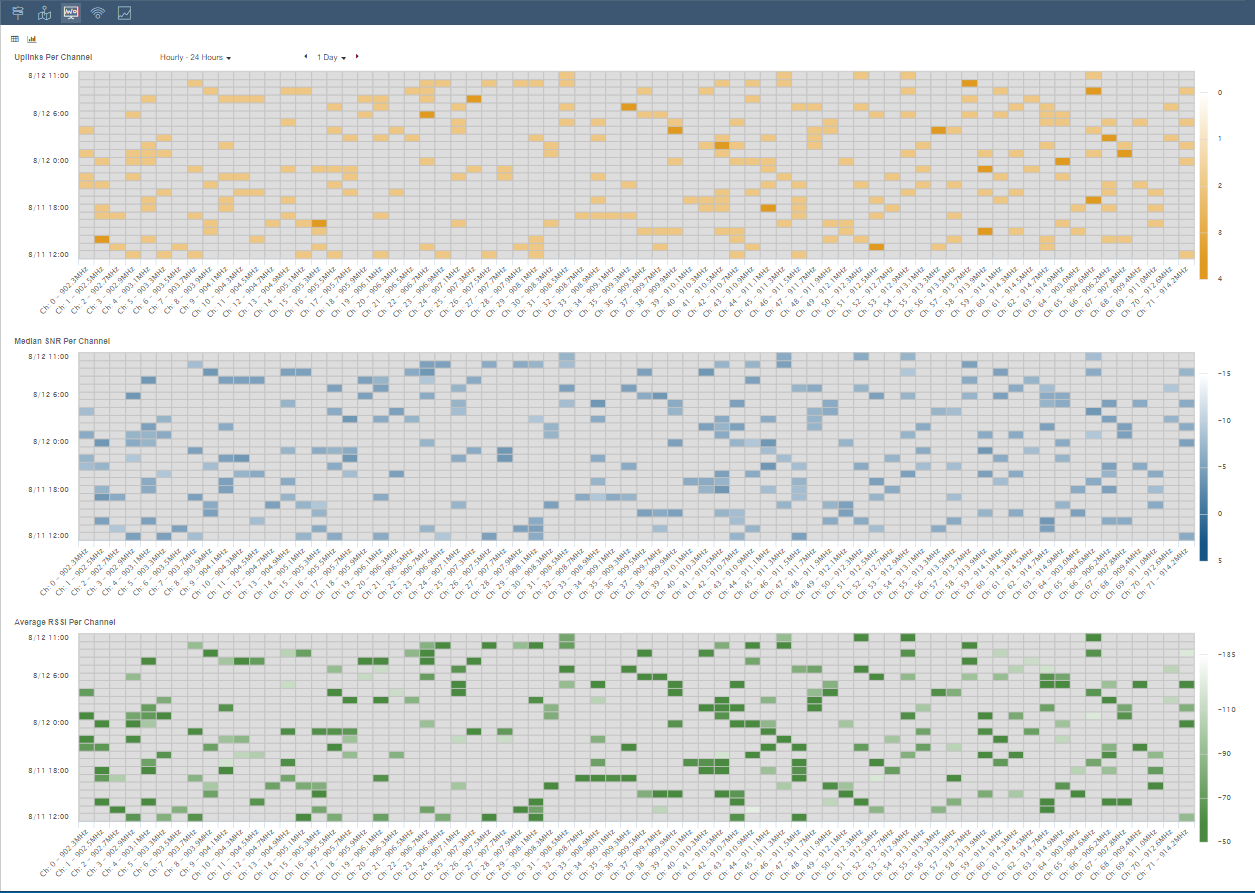
The view also supports displaying the backing data in table format as shown here:

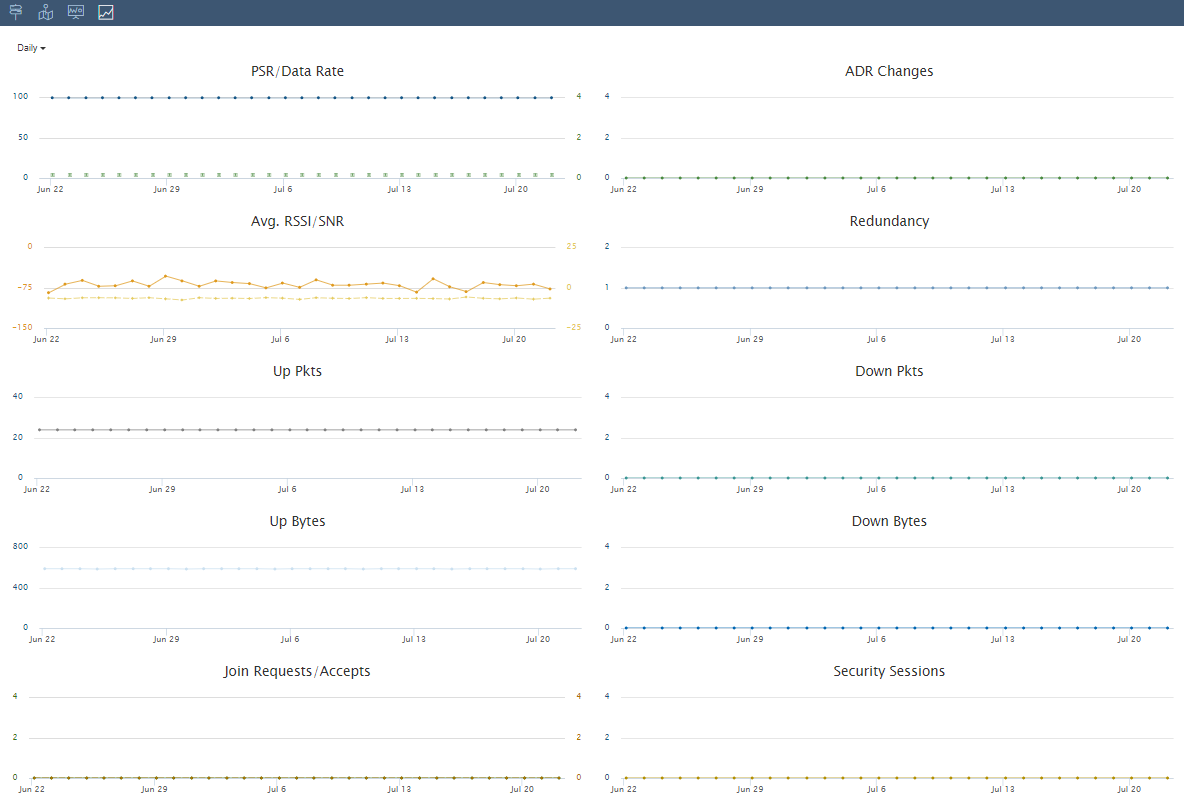
Device Statistics
The Device Statistics view shows historical charts of important Device data, such as PSR, Data Rate, RSSI, SNR and others. The view supports displaying the statistics in hourly, daily and lifetime timeframes.
| Chart | Description |
|---|---|
| PSR/Data Rate | A combined chart showing the Device's historical PSR and Data Rate for each displayed time period. |
| Avg. RSSI/SNR | A combined chart showing the Device's historical RSSI and SNR values for each displayed time period. |
| Redundancy | A chart showing a count of the Base Stations hearing the Device for each displayed time period. |
| Up Pkts | A chart showing the count of northbound packets sent to the Network Server for each displayed time period. |
| Down Pkts | A chart showing a count of southbound packets sent to the Device for each displayed time period. |
| Up Bytes | A chart showing the count of northbound bytes sent to the Network Server for each displayed time period. |
| Down Bytes | A chart showing a count of southbound bytes sent to the Device for each displayed time period. |
| ADR Requests | A chart showing a count of the Data Rate requests that occur due to ADR for each displayed time period. |
| ADR Configuration Changes | A chart showing a count of the Data Rate changes that occur due to ADR for each displayed time period. |
| Up MAC Commands | A chart showing the count of the unique northbound packets containing MAC commands. |
| Down MAC Commands | A chart showing the count of the unique southbound packets containing MAC commands. |
| Join Requests/Accepts | A combined chart showing a count of join requests sent by the Device and counts of join accepts sent to the Device for each displayed time period. |
| Security Sessions | The number of successful joins processed for each displayed time period |
Note
MAC Commands used for Up/Down counts: ADRParamSetup, DeviceTime, DevStatus, DlChannel, DutyCycle, LinkADR,LinkCheck, NewChannel, Rekey, Reset, RXParamSetup, RXTimingSetup, BeaconFreq,BeaconTiming, PingSlotFreq, PingSlotInfo, DeviceMod
Estimated Location
The Estimated Location Map view is a diagnostic tool for evaluating the position of a Device based on different location algorithms. The algorithm used to determine location is configured in the Device Profile assigned to the Device. This view is only visible if Write to Events is enabled in the Profile with the Advanced Algorithm selected. If visible, the Map displays a yellow circle for the estimated location and a green circle for the configured location (if set) as shown here:
Clicking on the yellow circle toggles display of square markers that represent the position of the Device for each unique uplink event received by the Network Server. This can also be accomplished via the "Toggle Location History" button in the upper righthand corner of the Map view. Hovering over a square displays a tooltip that shows the calculated location and time of the event.
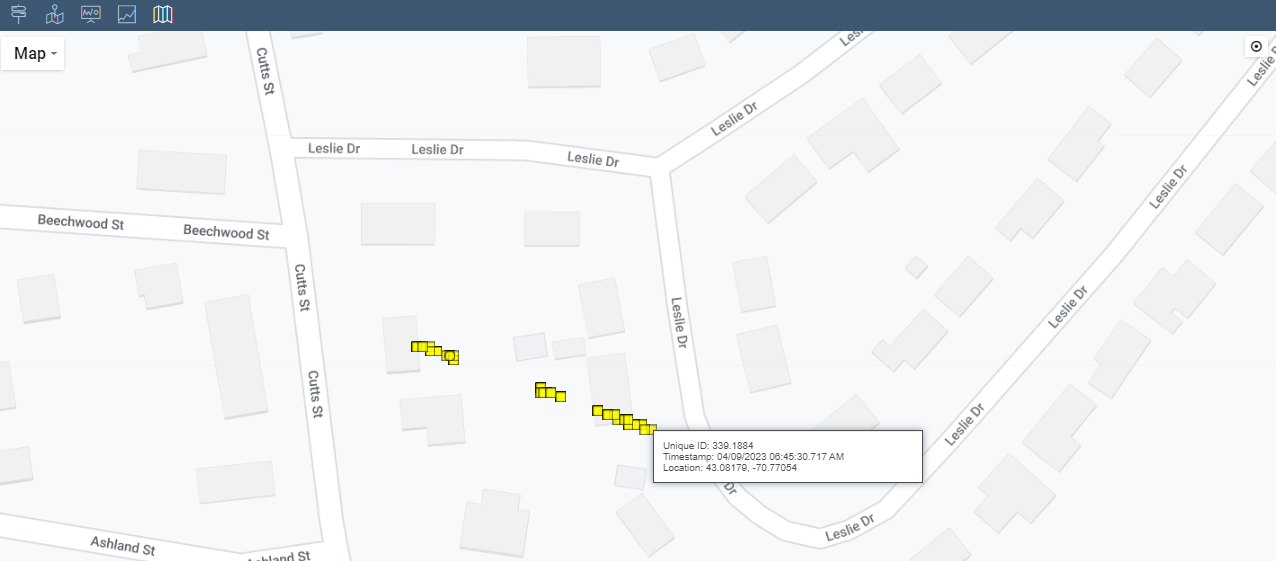
Estimated Location Tooltip Fields
| Field | Marker Type | Description |
|---|---|---|
| Unique ID | Square | The combined sequence number and join id of the unique uplink. |
| Last Updated | Circle | Time of the last uplink received by the Device |
| Timestamp | Square | Time associated with the historical location. |
| Location | Both | The computed or configured latitude and longitude of the Device. |
| Location Confidence | Circle | Confidence is a measure of how certain a Device is near the Estimated Location. The higher the confidence value, the more certain it is that a Device is near the Estimate Location. • The confidence value is incremented on each uplink and for each Base Station that heard the uplink and contributed to the calculation of an Estimated Location. • The confidence value is reset to 0 each time a Reset Trigger is calculated. |
Estimated Location Confidence Examples
- Device_A with a starting Confidence of 0
- An uplink for Device_A is heard by 1 Base Station
- The confidence value is incremented by 1: Confidence is 1
- A new uplink for Device_A is heard by 2 Base Stations
- The confidence value is incremented by 2: Confidence is 3
- Device_B with a starting Confidence of 10
- An uplink for Device_B is heard by 3 Base Stations
- The confidence value is incremented by 3: Confidence is 13
- A new uplink for Device_B is heard by 2 Base Stations
- A reset trigger is detected, confidence is reset
- The confidence value is incremented by 2: Confidence is 2
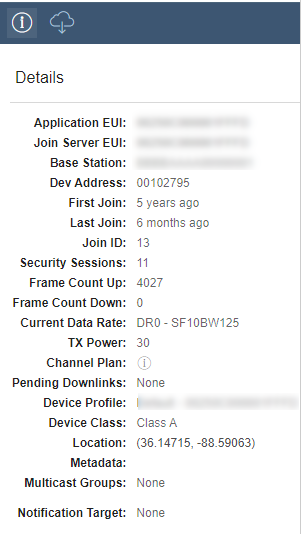
Details Info Panel
Provides Device metadata and an interface for sending downlinks to a Device.
Click  to hide.
 Details: Display current information about the Device
 Send Downlink: Send downlink PDUs to the Device
Multicast Group Status
The status of a Device that is in a Multicast Group is also displayed in the info panel.
| Collapsed View | Expanded View |
|---|---|
 |
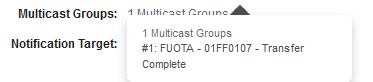 |
| Displays the total number of Multicast Groups the Device was recently a member of. | Shows the type, address, and status of the Groups with a link to the Multicast Group Details View |
Send Downlink
On-demand application downlinks can be sent directly from the Device Details view. A message is sent by specifying the message PDU and the target port on the Device. Message confirmation is enabled by checking the corresponding checkbox.
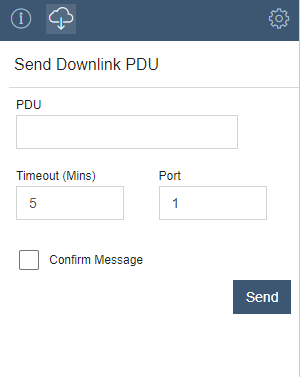
When operating as Class-B or Class-C, the Device's Details Send Downlink UI will display a Device Class selector.
Downlink options include:
- Class-A: Queue the downlink until the next uplink receive windows are available
- Class-B: Do not queue; send the downlink to the elected base station for transmit on the available next ping slot
- Class-C: Do not queue; transmit immediately.
![screenshot](img/dev-send-downlink-cla