Application Provider Documentation
Application Providers manage and monitor the health of one or more applications on the network. The Application Provider Portal provides application management features and visibility into the state of end Devices.
Application Views
Click on the header buttons to change the view.
 Dashboard: Message and notification statistics
 Events: View System Events, Application LoRa Events, and Device Management Events
 Devices: Devices that have joined the network
 Devices with Notifiers: Devices with custom notification targets
 Alerts: Application notifier alerts
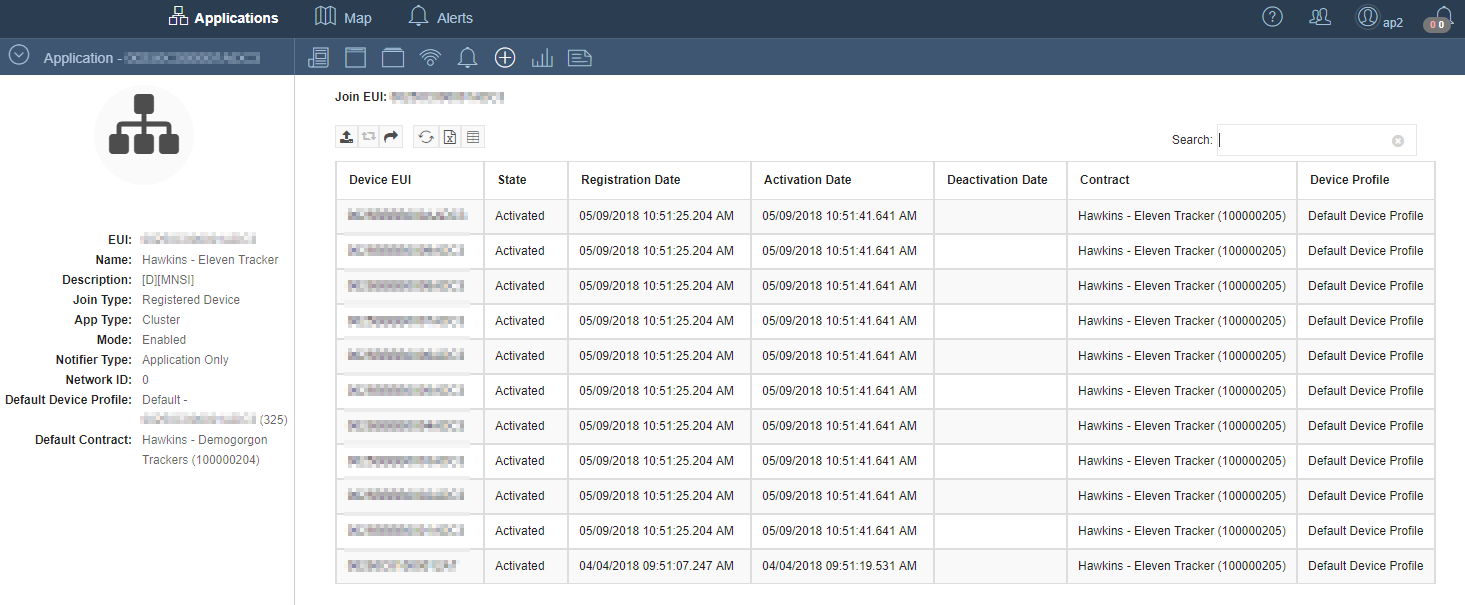
 Device Management: Registered, Activated and deactivated Devices
 Application Usage: Monthly and daily application statistics
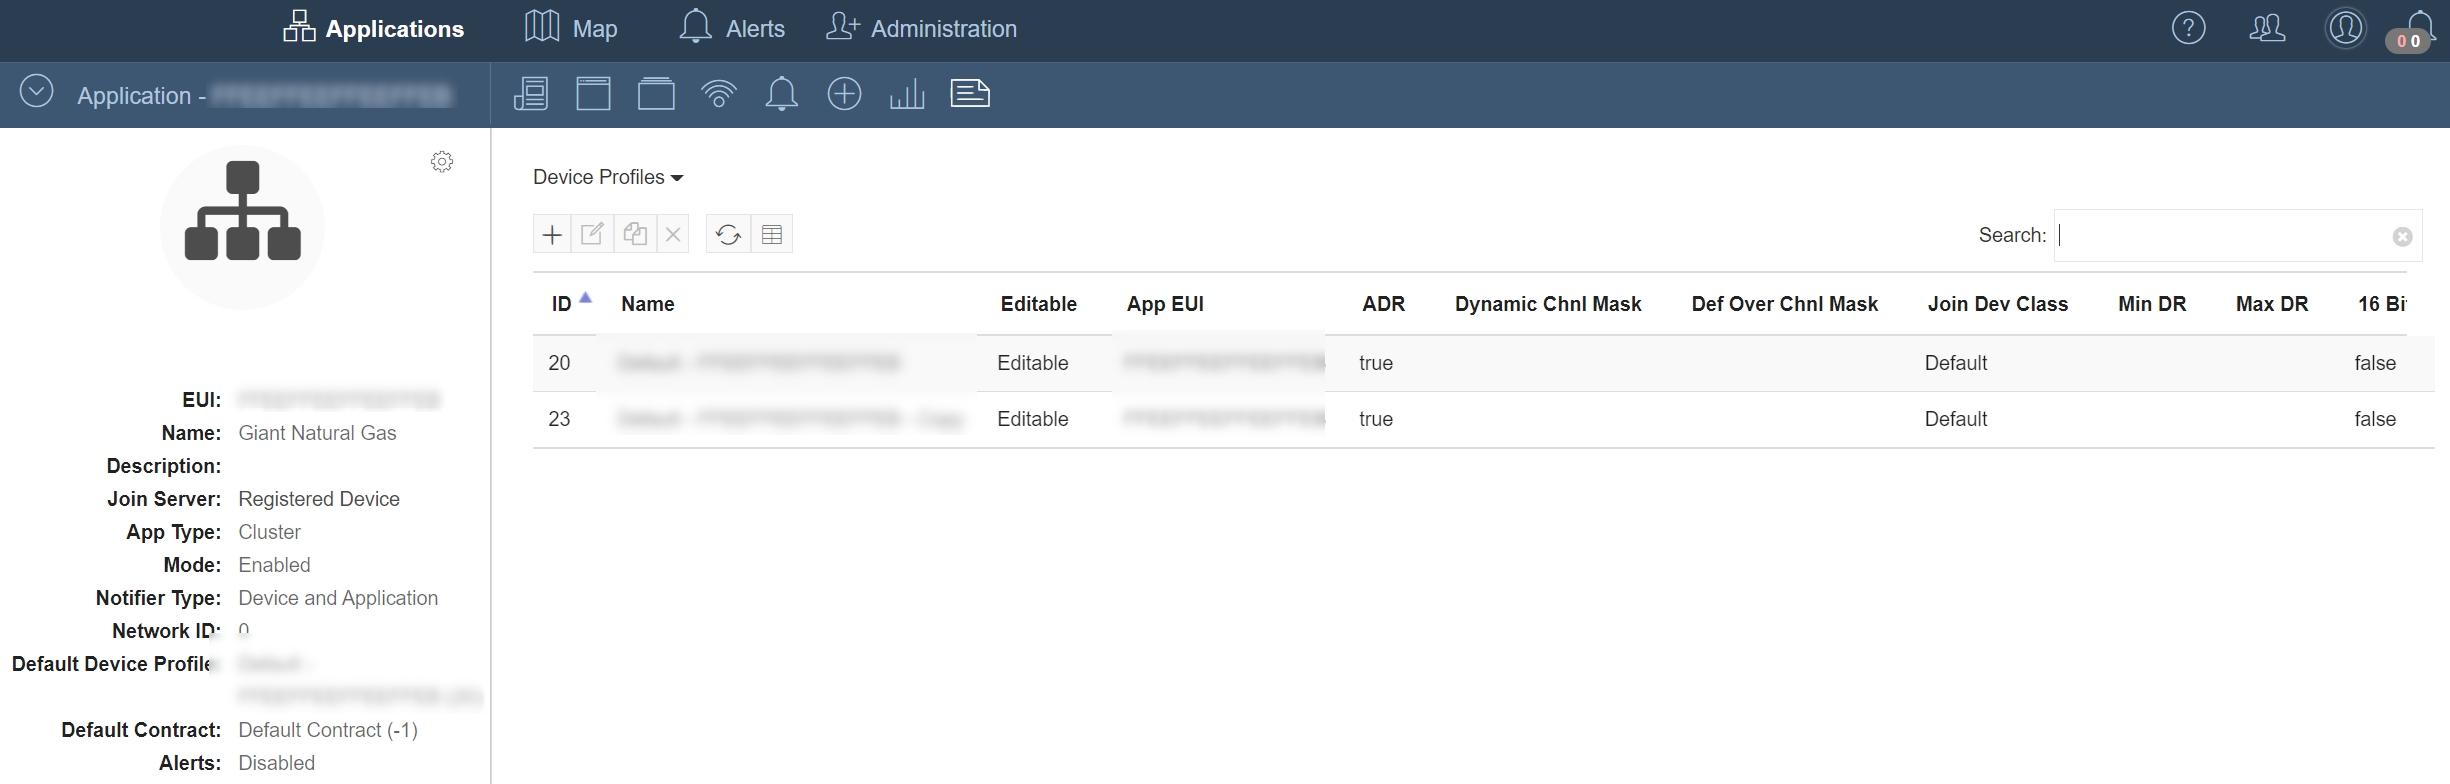
 Device Profiles and Contracts: Available Device profiles and contracts
 Multicast Groups: Current and expired Multicast Groups for the Application
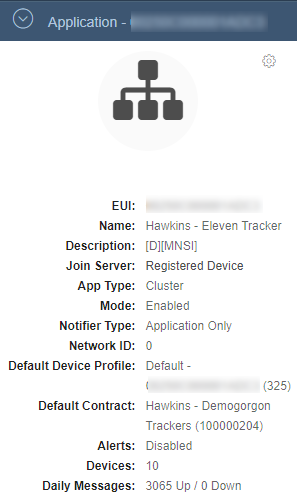
Details Panel
The Details Panel displays application metadata. Click on the  button to minimize.
Dashboard
The Dashboard view shows message and notification statistics for the managed application. Values are updated every 15 minutes. The selected time frame for the statistics can be set to 1, 7 or 31 days.
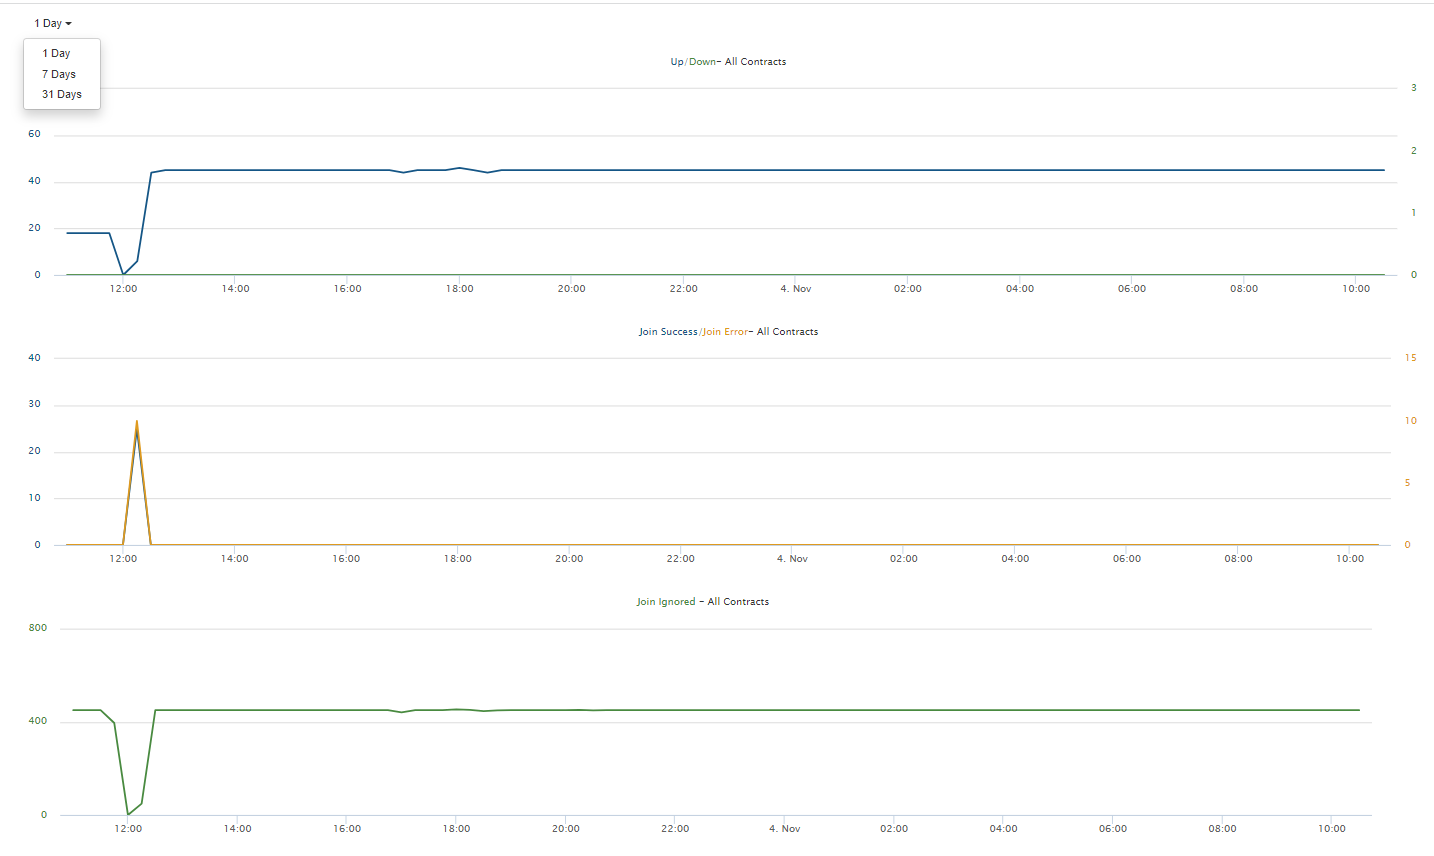
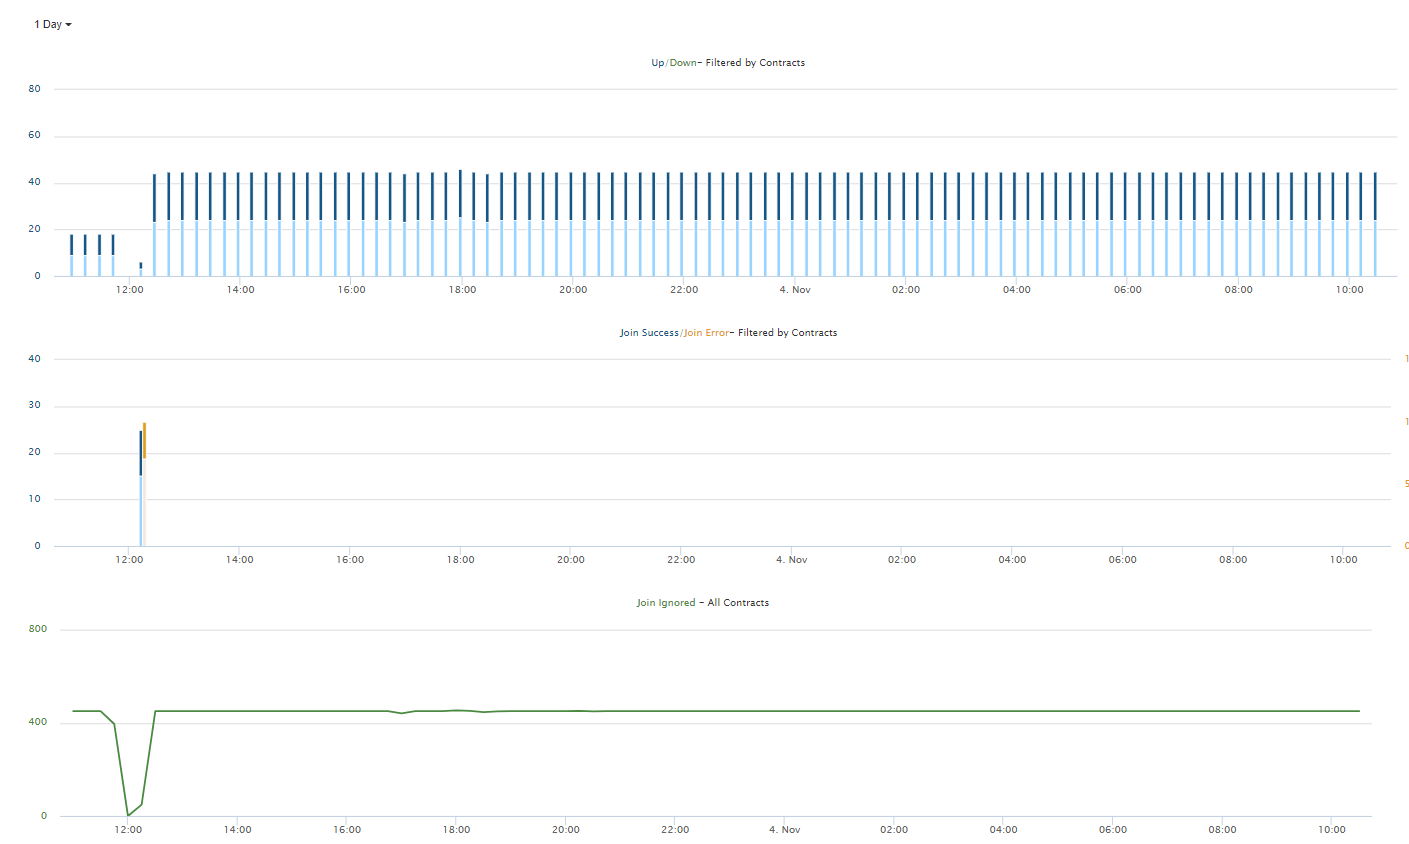
For Applications with more than one contract, the charts for Uplinks, Downlinks, Join Success and Join Errors support aggregation of the statistics by selected Contracts. The type of chart changes from line to column when Contracts are selected. This provides insight into the relative contribution of each Contract to the statistics.
The remaining charts are based on global statistics that cannot be scoped to specific Contracts. These do not support filtering by Contract.
| Chart | Description | Supports Contract Filtering |
|---|---|---|
| Up/Down | A combined chart showing the counts of Uplink and Downlink Device messages attributed to the Application. | Yes |
| Join Success/Join Error | A combined chart showing the counts of successful Device Joins and Join failures attributed to the Application. | Yes |
| Join Ignored | A chart showing the total number of ignored Join attempts attributed to the Application. | No |
| Notifications/Errors/Dropped | A combined chart showing the counts of successful, failed and discarded northbound messages attributed to the Application. | No |
| Avg. Request Time | A chart showing the average request time for forwarded northbound messages to all Application notification targets. | No |
Devices
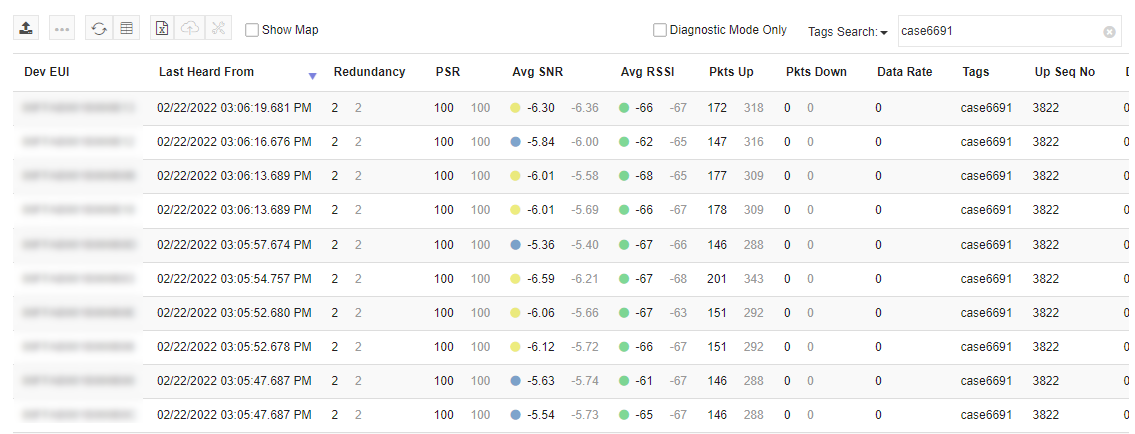
The Devices view displays transaction data for Devices that have joined the Netmore Network on the managed application.
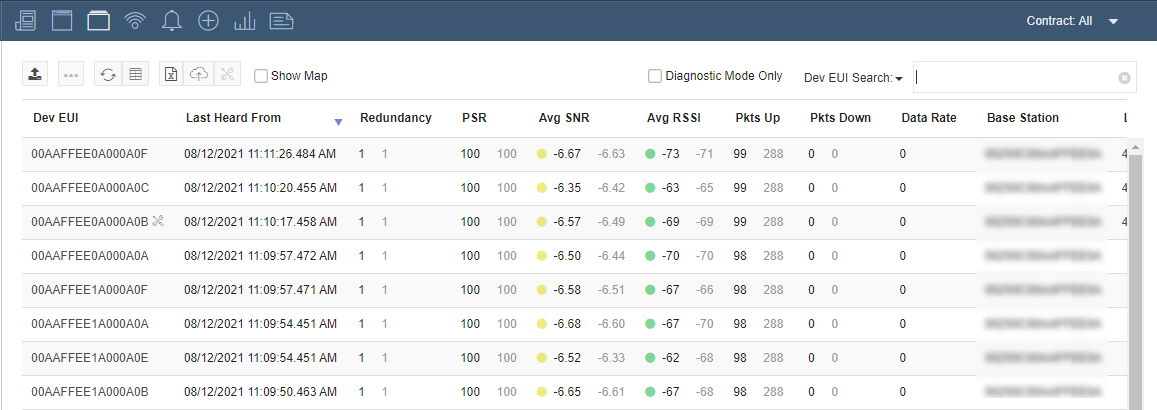
Use the Search bar to find Devices matching the selected field and search term.
Note
The search is only executed against the selected field to optimize performance. A search for a Device Address with the Dev EUI field selected would not return results unless the Device Address also happened to match a Device EUI.
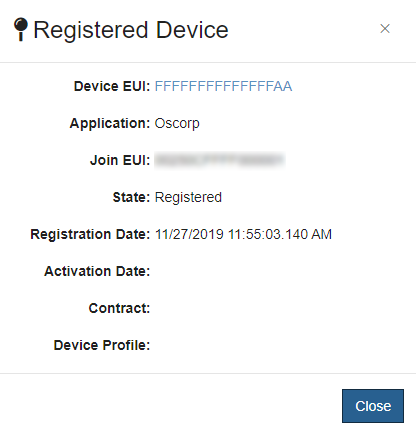
If a search for a full Device EUI fails, an option is provided to further search the Registered Devices. This is presented as a clickable link in the body of the Devices table.
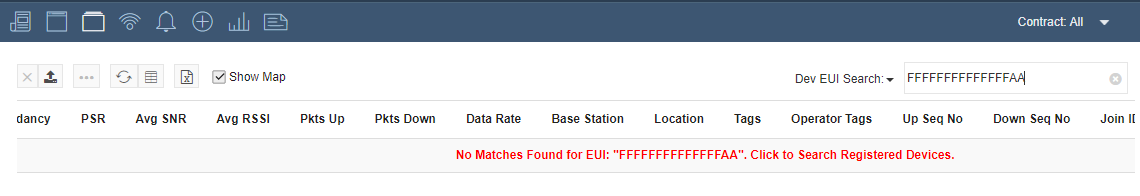
If that search succeeds, information about the found Registered Device is presented in a popup.
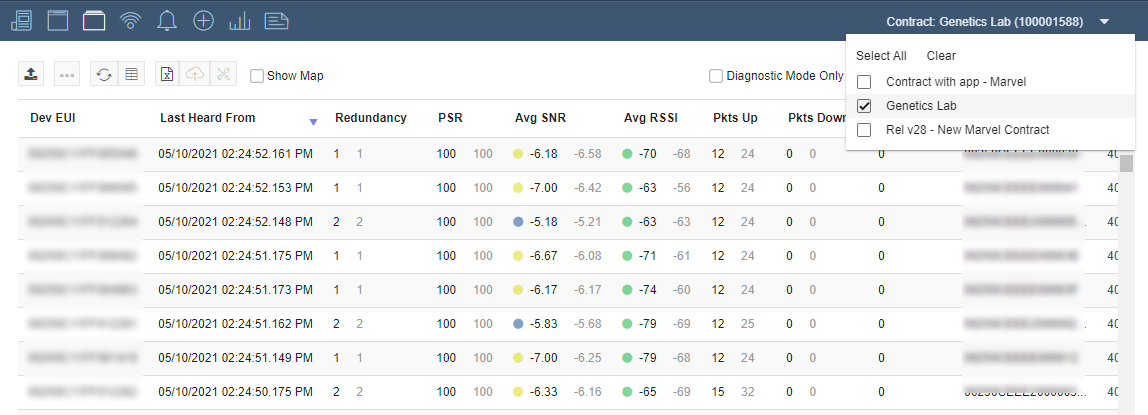
Devices can also be filtered to show the Devices for one or more selected Contracts. Here, the Devices for the GeneticsLab Contract are shown:
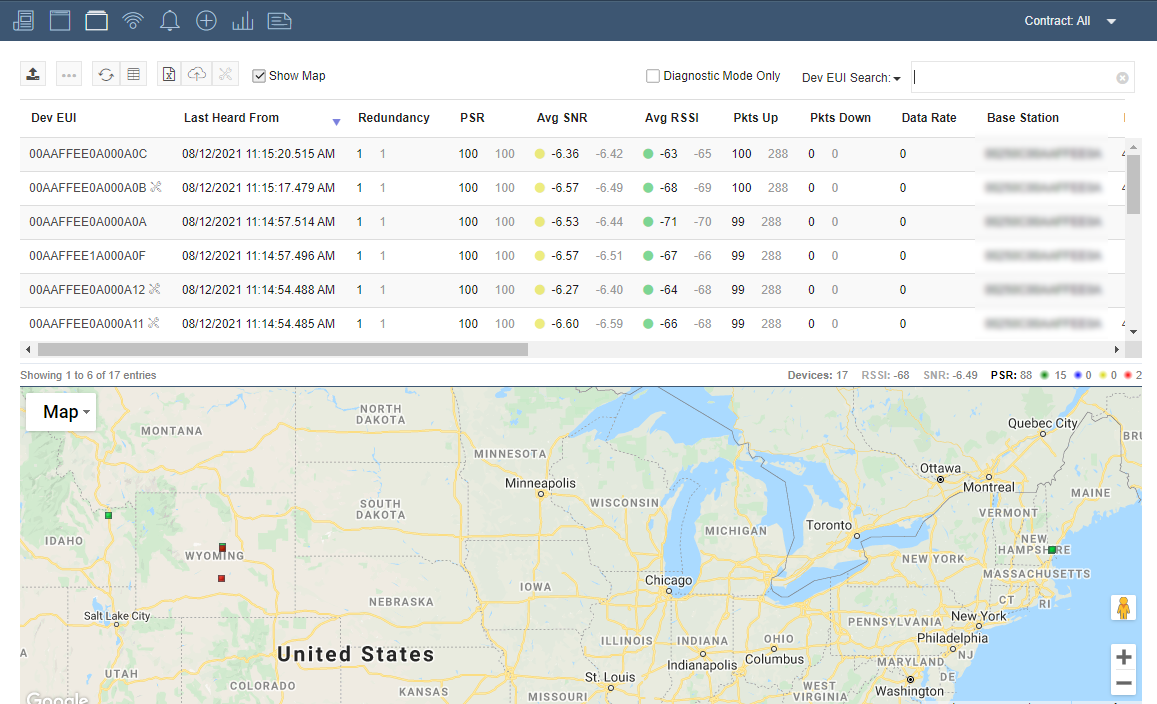
Checking the Show Map checkbox shows the Devices on a map if either the actual or estimated locations are known.
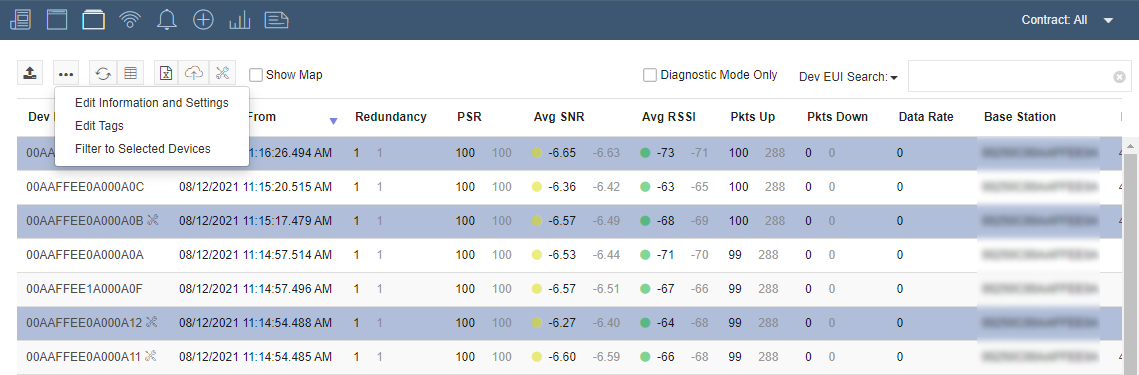
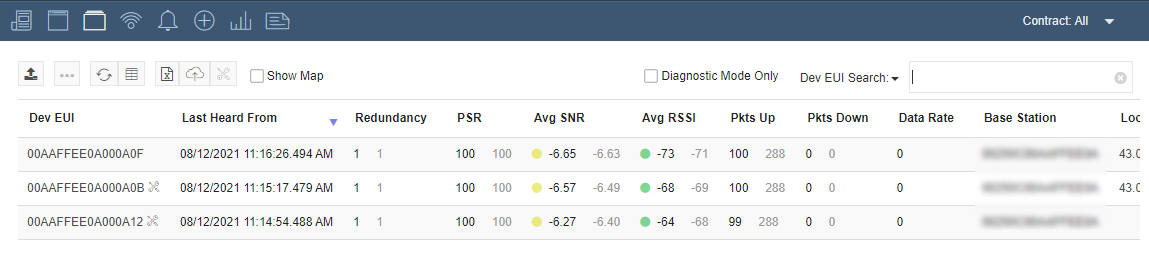
Select Filter to Selected Devices to limit the Devices view to a select group of Devices. This filtered view can be shown with or without the Map.
Note: The RSSI and SNR columns include color-coded icons to reflect the strength and quality of uplinks from each Device. The following table provides the meaning of each color along with the corresponding value-range. When hovering over an icon, this text will be displayed as a tooltip.
| Color | RSSI | SNR |
|---|---|---|
| Green | Very Good RSSI: >= -95 | Very Good SNR: >= 1 |
| Blue | Good RSSI: > -110 and < -95 | Good SNR: >= -6 and < 1 |
| Yellow | Fair RSSI: >= -125 and < -110 | Fair SNR: >= -13 and < -6 |
| Red | Poor RSSI: < -125 | Poor SNR: < -13 |
Device Table Buttons
 Update Devices: Upload a CSV file to update Device fields. See Device Update for more information.
 Device Configuration: Edit Information and Settings or Tags for the selected Devices
 Refresh: Manually request the latest data
 Settings: Control the column visibility
 Export: Export the table to a Excel file
 Firmware Upgrade: Update the firmware for the selected Device
 Diagnostic Mode: Put selected Devices in Diagnostic Mode
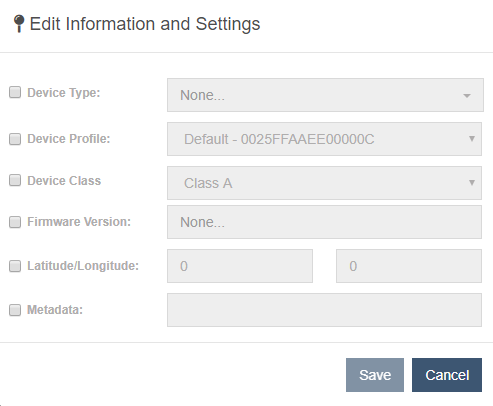
Device Configuration
The following Device information can be set in the Information and Settings dialog: Device Type, Device Profile, Device Class, Firmware Version, Latitude and Longitude and Metadata.
Adding and Removing Tags
Tags are used for grouping and filtering Devices. One or more tags can be added to selected Devices in the table. To remove multiple tags at the same time, insert the tag names into the dialog separated with a comma, ex. "Tag1,Tag2,Tag3".
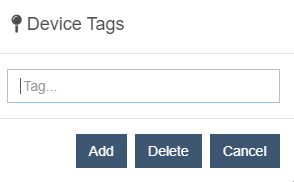
Then, entering a tag in the search box of the table will find Devices matching that tag.
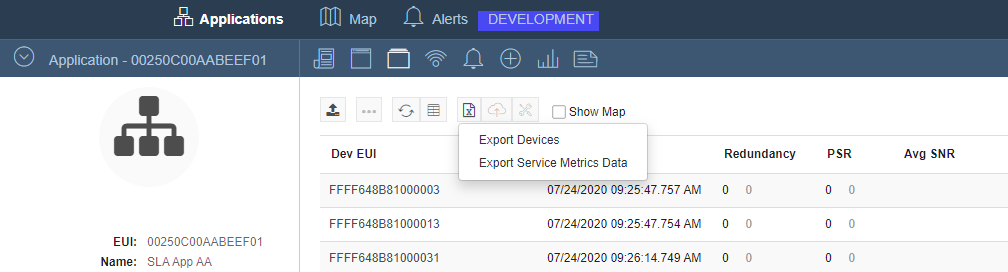
Exporting Device Service Metrics Data
Service Metrics data is calculated based on the terms of an associated Contract. The data can be exported from the Application Details Devices view.
-
Click on the Export button in the view to display a menu showing available export options.
-
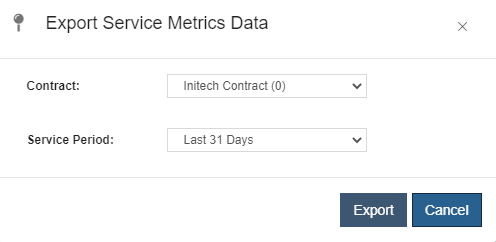
Click on Export Service Metrics Data to show a dialog presenting a list of Contracts associated with the Application.
-
Select the desired Contract and Service Period and click the Export button to begin the export.
-
The data is exported to an Excel formatted file that appears in the lower left corner of the browser. The columns Metric A, Metric B and Metric C in the exported file, show the percentage of days within a 31 day period that a Device sent an uplink within the associated time window.
Diagnostic Mode
Enabling Diagnostic Mode for a Device adds it to the Developer Dashboard and enables notifiers. Devices with Diagnostic Mode enabled will appear in the Devices table with an icon next to their EUI. Clicking on an EUI will open the Device Details view. Diagnostic Mode can be enabled on a limited number of Devices. Please contact support@netmoregroup.com to increase the limit for an account.
Details Panel
The Details Panel on the left side of the image above allows users to create or edit a custom Notification Target, send downlinks and view Device information and statistics. Click on the button to minimize.
 Details: Display current information about the Device
 Send Downlink: Send downlink PDUs to the Device
 Edit Device: Open the Edit Device window (see below). This button is only visible if Diagnostic mode is enabled for the Device.
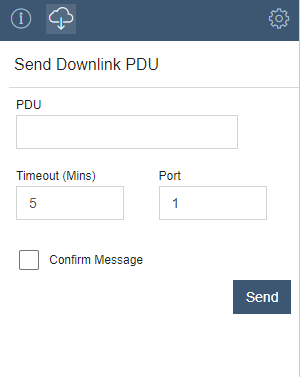
Send Downlink
On-demand application downlinks can be sent directly from the Device Details view. A message is sent by specifying the message PDU and the target port on the Device. Message confirmation is enabled by checking the corresponding checkbox.
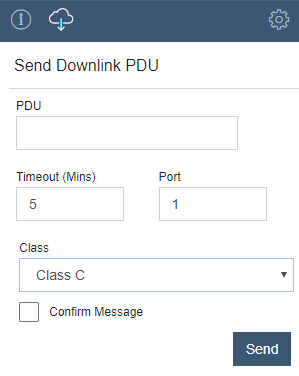
When operating as Class-B or Class-C, the Device's Details Send Downlink UI will display a Device Class selector.
Downlink options include:
- Class-A: Queue the downlink until the next uplink receive windows are available
- Class-B: Do not queue; send the downlink to the elected base station for transmit on the available next ping slot
- Class-C: Do not queue; transmit immediately.
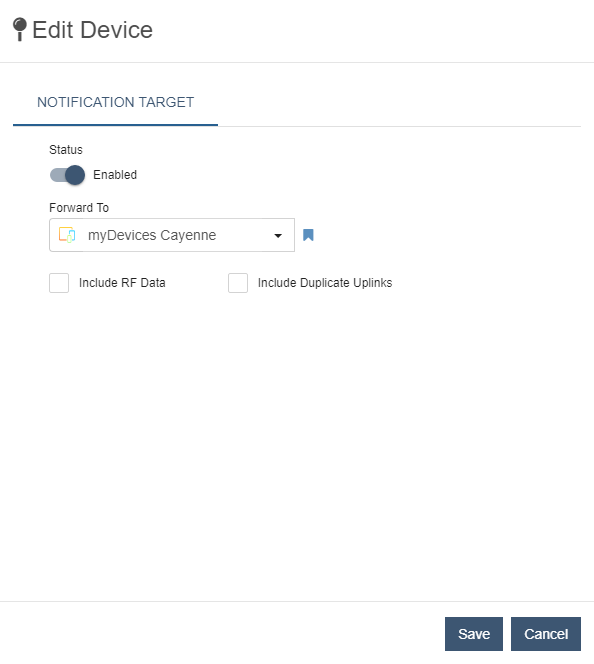
Edit Device
Create a custom Notification Target or edit the previously configured Notification Target. Devices with custom Notification Targets will appear in the Devices with Notifiers view. See the Developer Streaming documentation for more details.
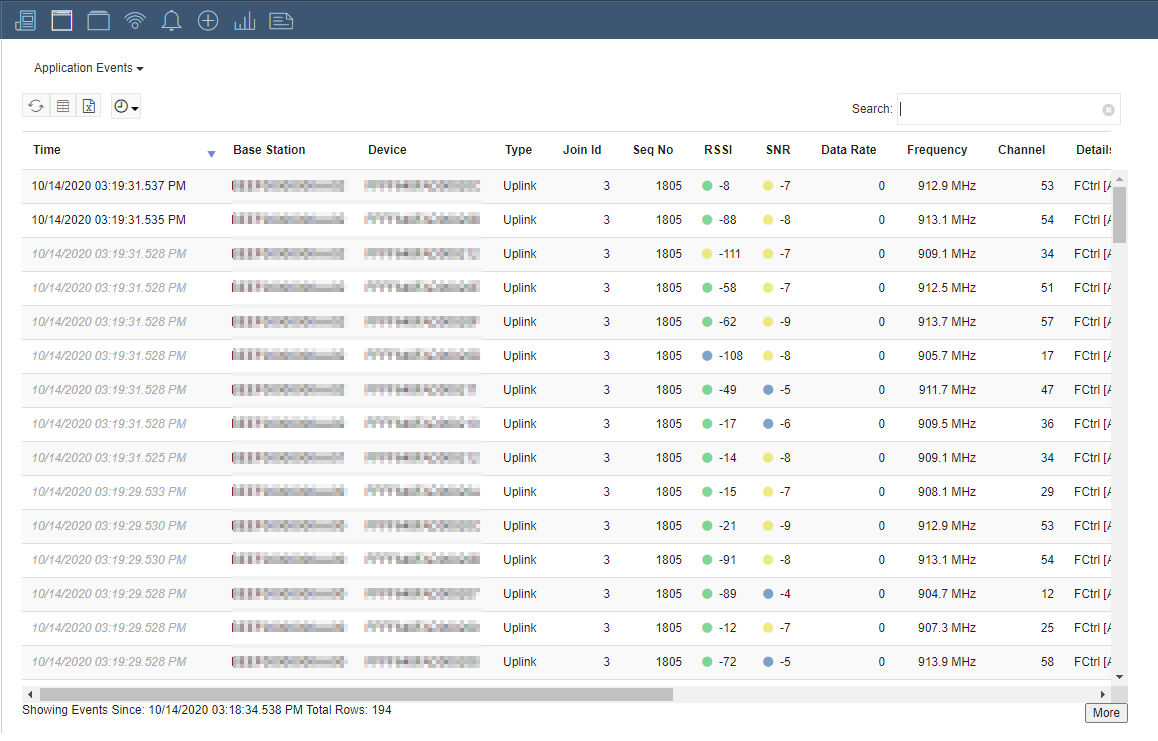
Application Events
The Application Events view provides a consolidated view of the LoRa events associated with the Application. Like other event views, the Application Events may be filtered by date and time to focus events that occurred at a specific point in time. Events may also be traversed historically using the "More" button. Events that are received late are specifically identified with light italicized text on the Time column.
System Events
System events are system level events for the Application and Join Servers. This table allows you to navigate these events to help troubleshoot issues with the Application.
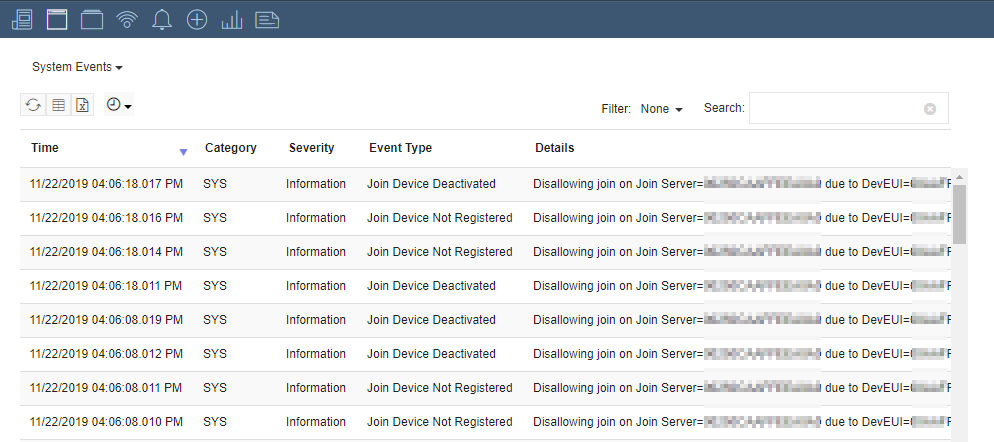
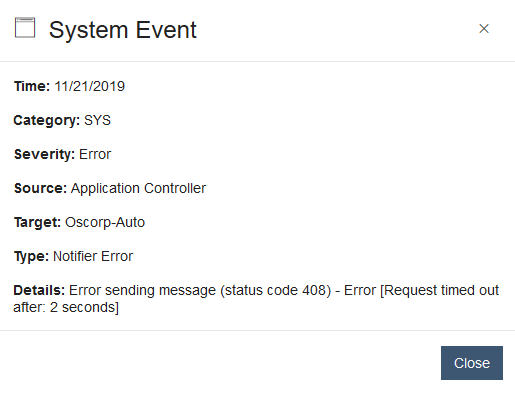
Clicking on a system event allows you to view the details of the event.
Device Management Events
Device management are specific audit events generated by Device management changes. They contain the details of the changes including; The time the changes took place, which Devices were changed (Ids), who completed the changes (Username), and how the changes were performed (Authentication). Events are generated in batches of 500 devices so it is not uncommon to see several events for a single change.
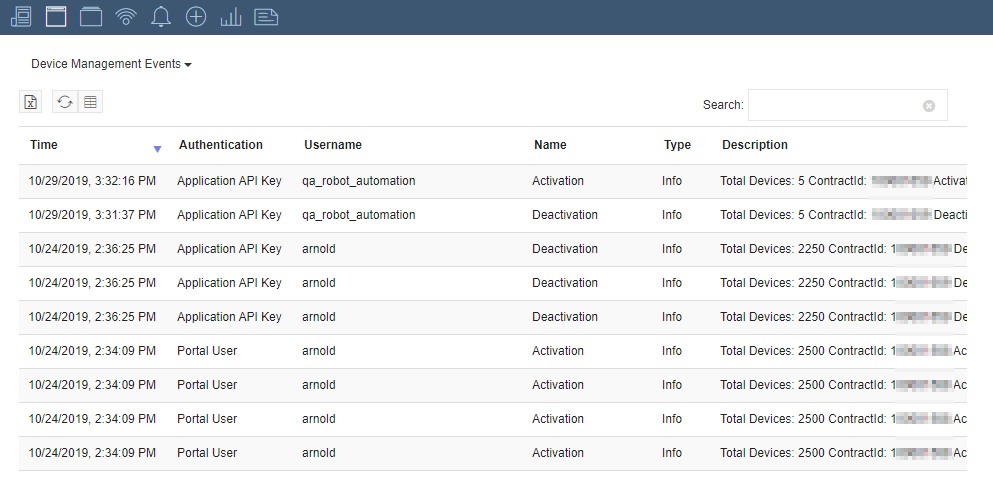
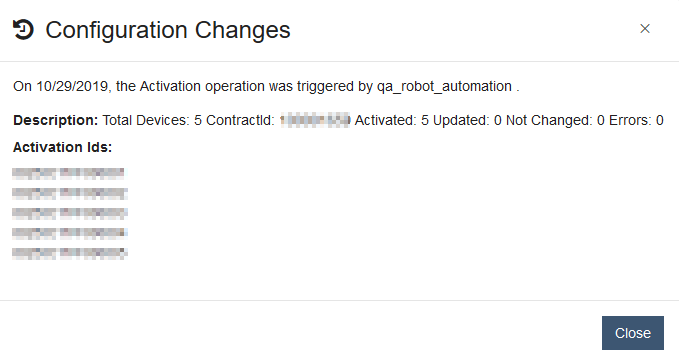
You can view the details of an event by clicking on a row in the table which launches a dialog.
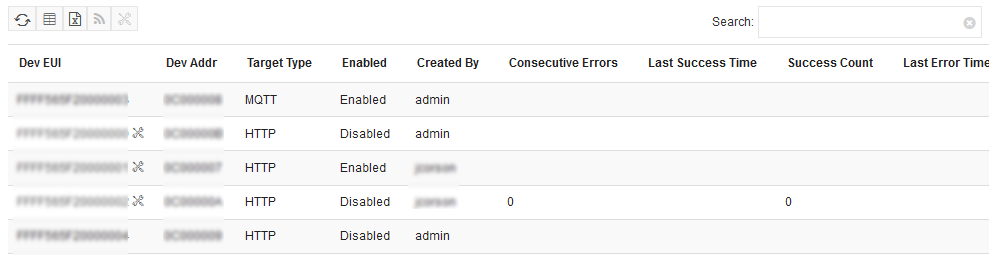
Devices with Notifiers
Streaming data for Devices with custom notification targets are displayed in the Device with Notifiers view.
Use the Search bar to find Devices by their EUI.
Refresh: Manually request for the latest data
Settings: Control the column visibility
Export: Export the table to a CSV file
 Edit Device Notifier: Edit the selected Device's notification target.
Note
Devices must be in diagnostic mode in order to edit their notifier. If a Device is not in diagnostic mode, it can be enabled using the Toggle Diagnostic Mode button.
 Toggle Diagnostic Mode: Toggles the diagnostic mode state of a Device within the notifiers table. Rows marked with the same icon as the button are already in diagnostic mode.
Note
Disabling diagnostic mode removes the notifier. Doing so from this table will remove the Device from the table.
Device Management
The Device Management view shows Device onboarding data. See the Device Management page under Devices for additional details about available actions.
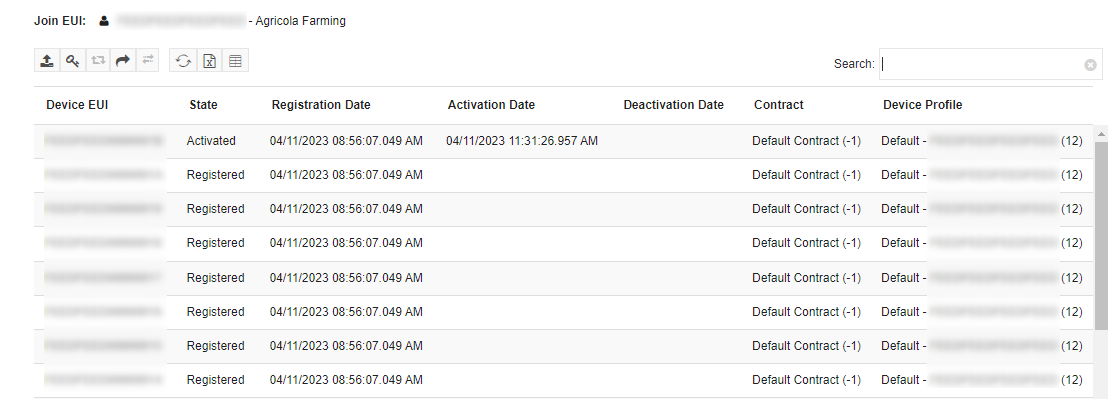
Use the Search bar to find Devices by their EUI.
Upload: Upload a CSV file to Register, Activate or Deactivate Devices
 Update Application Keys: Upload a CSV file to update the Application keys for Devices. This performs the same action as Device Update
 Activate/Deactivate: Activate or Deactivate the selected Devices
 Request Token: Request a Device registration token
 Device Transfer: Provides a menu with options to transfer Devices between Join Servers or Accounts.
 Add Device for Unknown/Unregistered Join Server: Register a single Device with an unknown or unregistered Join Server.
Refresh: Manually request for the latest data
Settings: Control the column visibility
Device Profiles
A Device Profile can be leveraged to serve multiple purposes, it allows for the configuration of certain Device attributes that aide the network in properly managing the Device behavior. For example, the profile allows for the definition of an expected transmit interval. This transmit interval helps to identify how well a Device is performing against its daily expected communication profile.
The Device Profile also allows for the configuration of certain options that can be useful during testing and QA efforts. For example, the minimum/maximum Data Rate or range that a Device can operate at can be defined through the profile. A Device can be forced to operate at a Data Rate that is either higher or lower than that which the network would normally decide. Additional attributes that can be controlled include, but are not limited to; Tx power, Channel Plan, operational LoRa Version of the Device. See Device Profiles under the Devices menu for more details on Device Profile management.
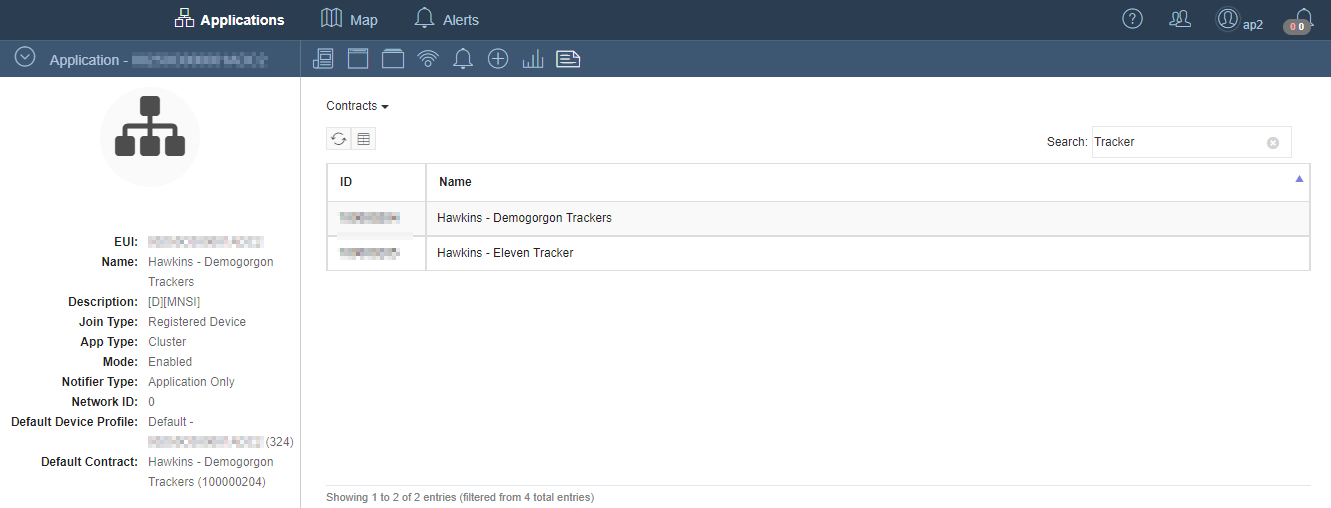
Device Contracts
The Device Contracts view shows all Contracts created for the Application that can be used to group Devices for billing and usage data collection. See the Device Contracts section under Application Usage and Accounting for more details.
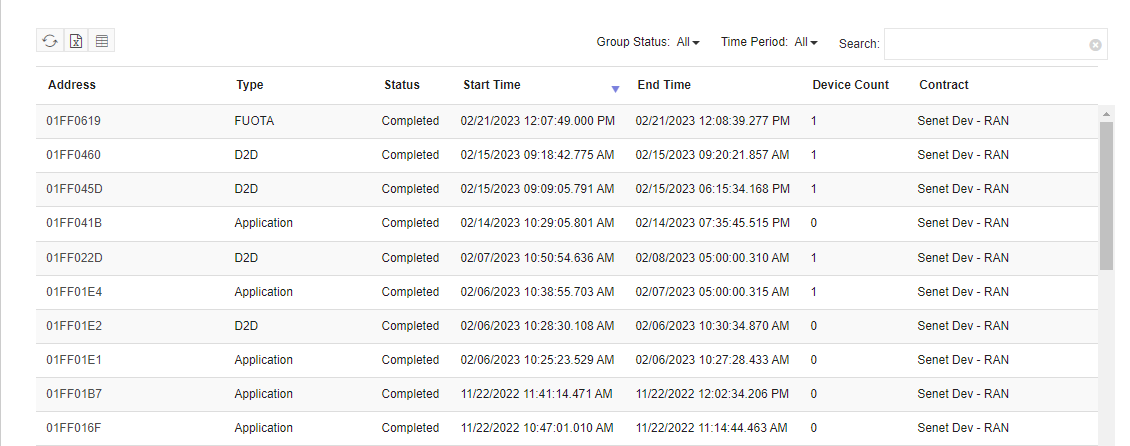
Multicast Groups
This view displays all Multicast Groups for the selected Application. Multicast Groups fall into three categories: FUOTA, Application and Device To Device. The FUOTA groups are initiated by setting up a FUOTA transfer through the UI or through the FUOTA API. Application and Device to Device Multicast Groups can be initiated through the Multicast API.
Columns
| Field | Description |
|---|---|
| Address | The Multicast Group address used when communicating with the Multicast Group. |
| Class | (Hidden by default) The LoRaWAN class of the Multicast Group. This can be either C or B. |
| Periodicity | (Hidden by default) The periodicity of the Class B session setup for the Multicast Group if the group is a Class B group. |
| Type | The type of Multicast Group: • FUOTA - Used to transfer a firmware update to the group of Devices • D2D - A Multicast Group adhering to the frame counter logic which allows for Device to Device communication. • Application - A Multicast Group allowing standard multicast downlinks to be sent from the Application to the group. |
| Status | The current status of the Multicast Group. |
| Start Time | The time the Multicast Group was setup and started with the first Devices. |
| End Time | The time that the Multicast Group was completed and shutdown. |
| Frequency | (Hidden by default) The frequency that downlinks will use for the Multicast Group. |
| DR | (Hidden by default) The data rate that downlinks will use for this Multicast Group. |
| Min FCnt | (Hidden by default) The minimum frame counter allowed to be used for this Multicast Group. |
| Max FCnt | (Hidden by default) The maximum frame counter allowed to be used for this Multicast Group. |
| Down Pkts | (Hidden by default) The count of downlink packets sent from the Senet Network Server to the Multicast Group. |
| Down Bytes | (Hidden by default) The count of bytes sent from the Senet Network Server to the Multicast Group. This does not includes bytes sent during Device to Device communication. |
| Device Count | The current Device count or the count of Devices at completion for groups that are now Completed. |
| Base Station | (Hidden by default) The list of Base Stations used to communicate with the Multicast Group. |
| Contract | The contract used for billing on downlinks to the Multicast Group. |
Table Filters
| Filter | Description | |
|---|---|---|
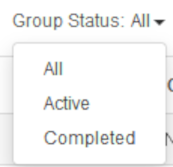 |
Group Status | All - Lists both active and completed Multicast groups Active - Filters the view to only Multicast Groups that have not ended yet. This can include ongoing FUOTA transfers along with Application and Device to Device groups that have not hit their expiration date. Completed - Filters the list to the FUOTA transfers that have finished or were canceled along with the Application and Device to Device multicast groups that have expired or were manually stopped. |
 |
Time Period | Filters the Multicast Group table to include Groups that have an End Time that falls within the selected period. |