Reports
Reports display high level statistics for Base Stations on the Network. The following reports can be displayed via selection from the list of available reports.
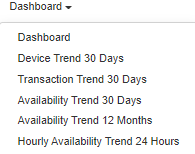
- Dashboard
- Device Trend 30 Days
- Transaction Trend 30 Days
- Availability Trend 30 Days
- Availability Trend 12 Months
- Hourly Availability Trend 24 Hours
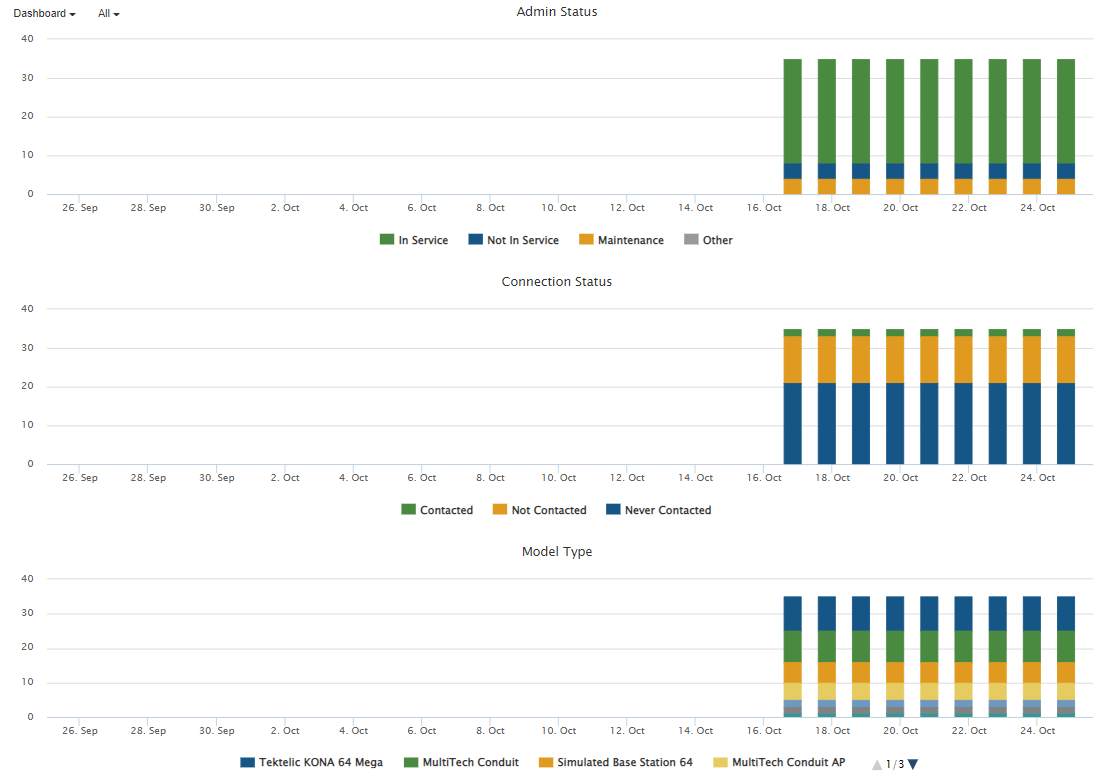
Dashboard
The Dashboard report shows daily breakdowns of Base Station counts by the following statistics:
- Admin Status - In Service, Not In Service, Maintenance, or Other
- Connection Status - Contacted, Not Contacted, or Never Contacted
- Model Type - Tektelic Kona 64 Mega, Multitech Conduit, Laird Sentrius, and others
The report can be filtered to show Base Station statistics by selected RAN Contract and all Base Stations with a Contract or those without a Contract.
The statistics are displayed in stacked column charts with legends listing each statistic and the associated color. The legend items can be clicked to toggle presentation of each statistic, facilitating display of smaller values that may otherwise be hidden.
Trend Reports
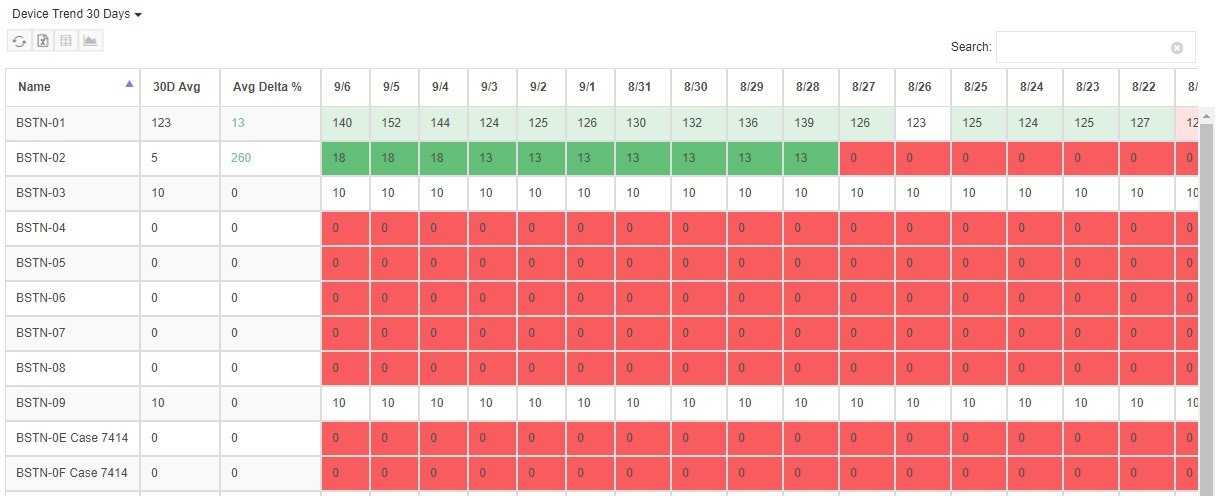
The following color scheme is used for all trend reports:
| Condition | Color |
|---|---|
| <=25% | Red |
| >25% < 50% | Light Red |
| >50% <= 99% | Lighter Red |
| >99% <= 101% | White |
| >101% <= 125% | Light Green |
| >125% | Green |
| N/A | Grey |
Device Trend 30 Days
The Device Trend report shows the number of devices heard by each Base Station over the last 30 days.
Select Device Trend 30 Days
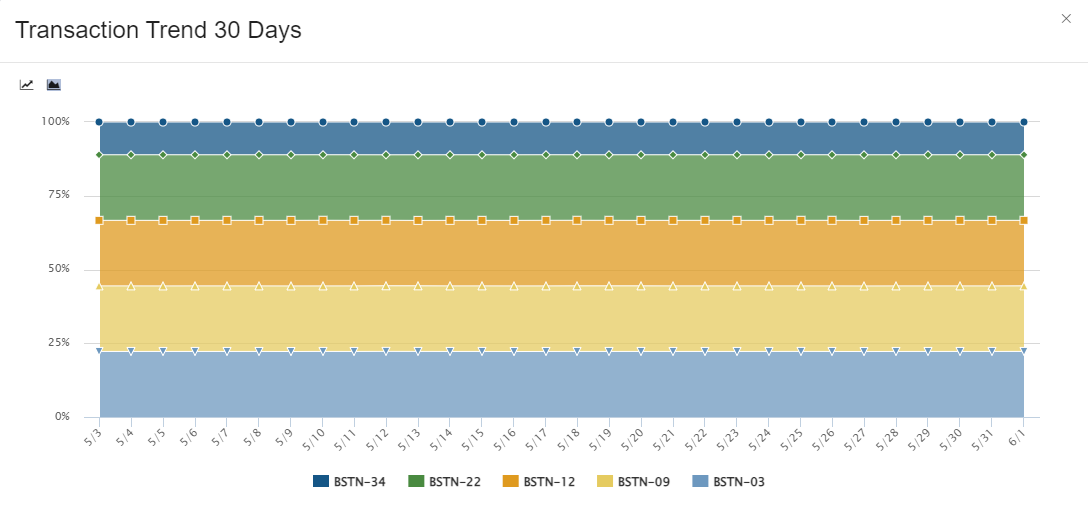
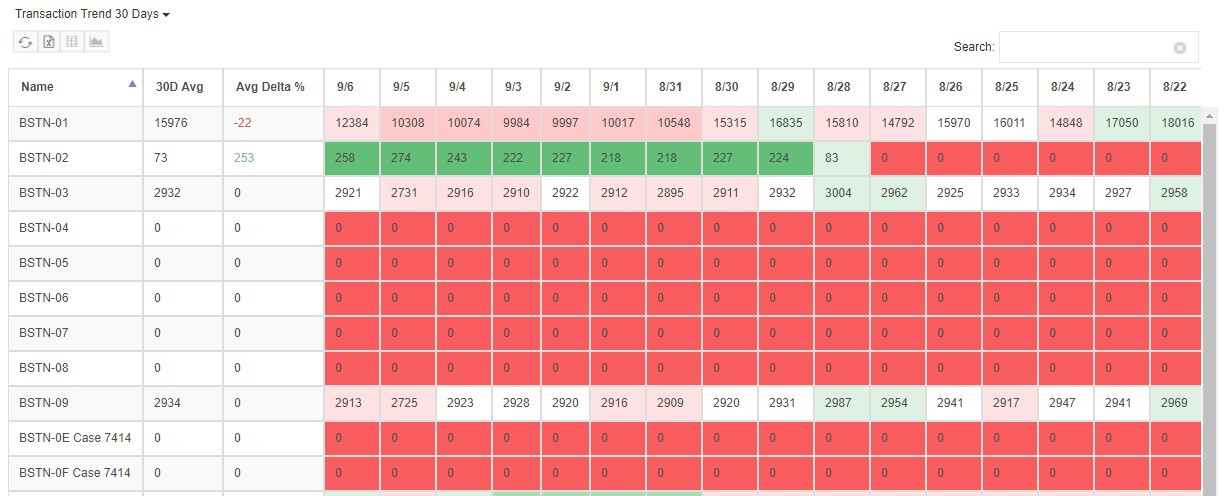
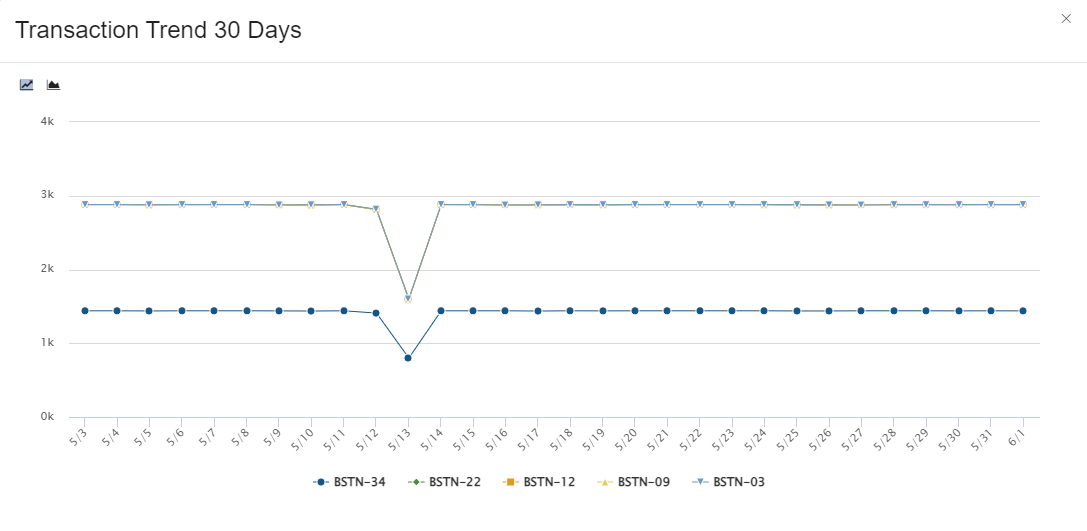
Transaction Trend 30 Days
The Transaction Trend report shows the number of transactions heard by each Base Station over the last 30 days.
Select Transaction Trend 30 Days
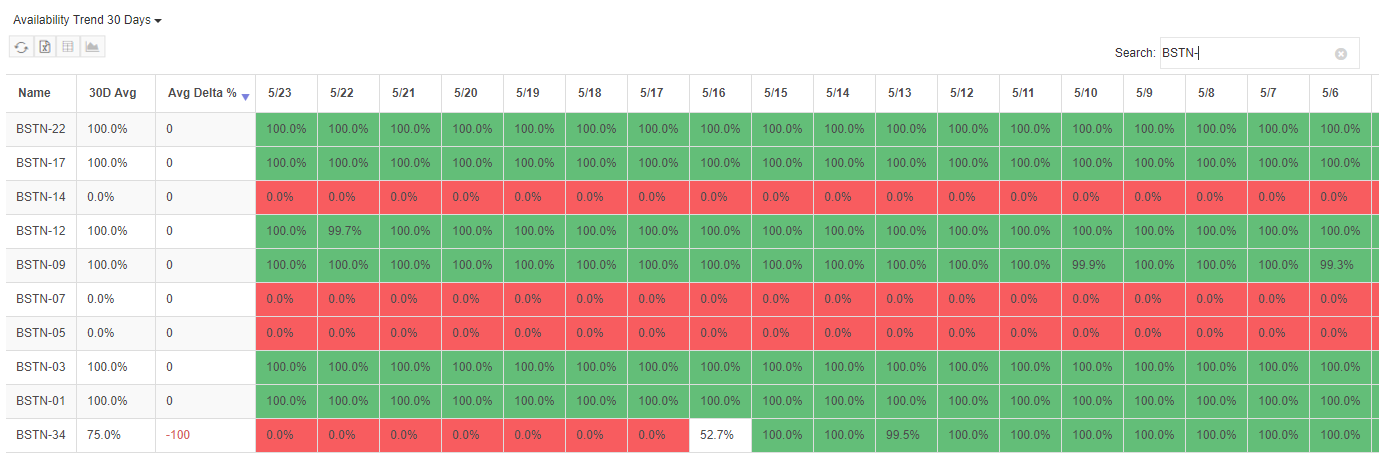
Availability Trend 30 Days
The Availability Trend report shows the daily availability of the Base Station over the last 30 days.
Select Availability Trend 30 Days
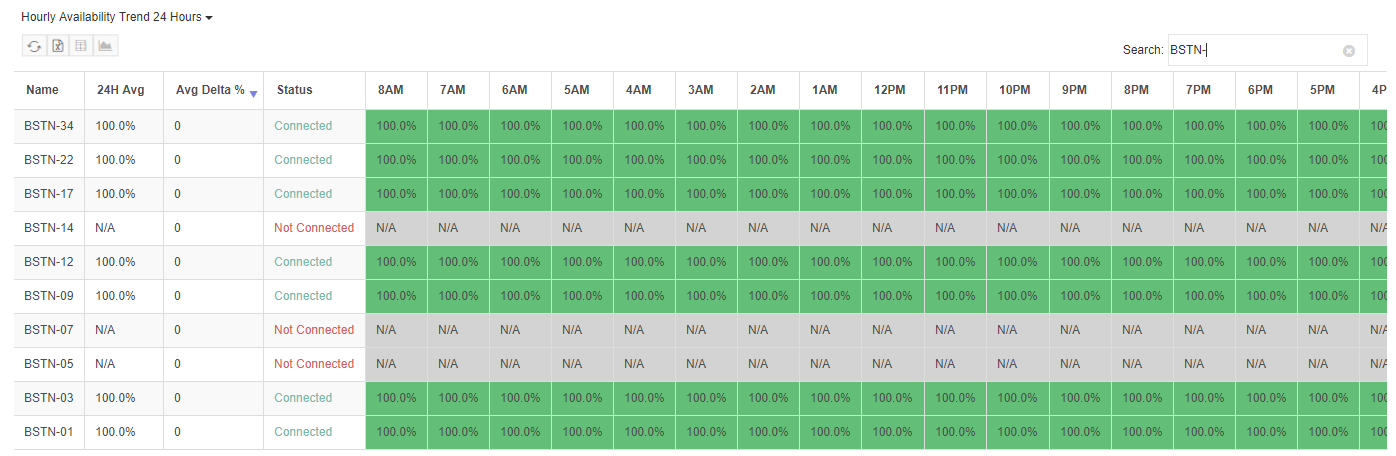
Hourly Availability Trend 24 Hours
The Hourly Availability Trend 24 Hours report shows the hourly availability of the Base Station over the last 24 hours.
Select Hourly Availability Trend 24 Hours
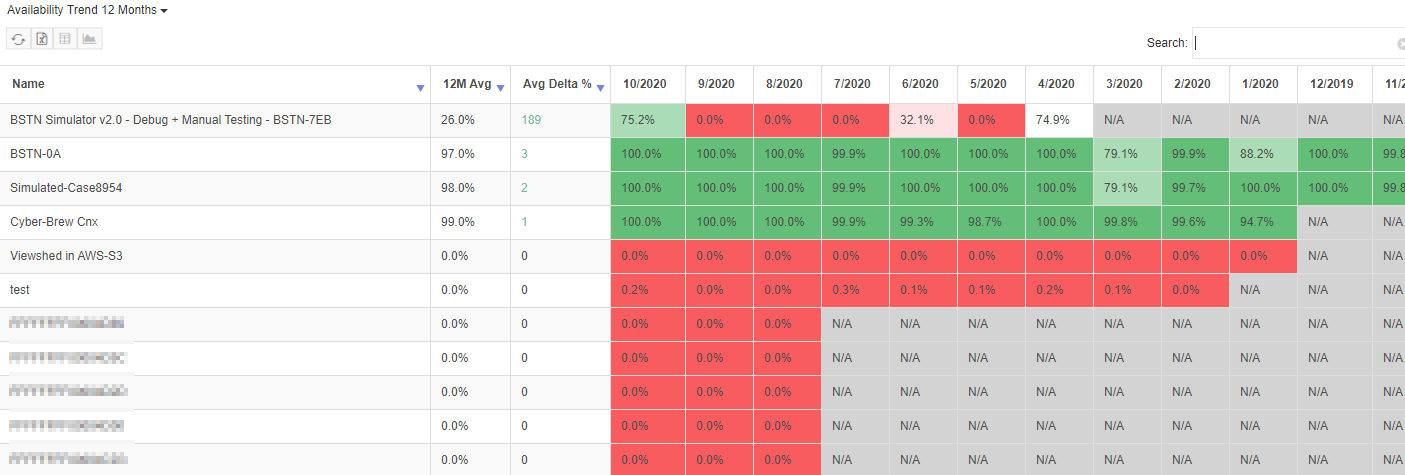
Availability Trend 12 Months
The Availability Trend 12 Months report shows the monthly availability of the Base Station over the last 12 months.
Select Availability Trend 12 Months
Trend Report Chart Views
Each of the trend reports has a Trend Chart button  that launches a chart view of the report data. The button is enabled when up to 10 rows are selected in the report table. The button is disabled if no rows are selected or if more than 10 rows are selected. Except for the Availability reports, the chart view can display the data in 2 ways:
Line
The line chart view shows absolute values for Device, Transactions and Availability. Device and Transaction values are counts and Availibilty values are percentages.
Stacked Area
The stacked area chart view, when available, shows proportionate values of the selected whole. That is, a stacked area chart is analagous to a horizontal pie chart, where each value represents a percentage of the total.