Base Station Details
Base Station details show the health history of a Base Station, the events it is processing, RF statistics, diagnostics, and transaction statistics.
Summary
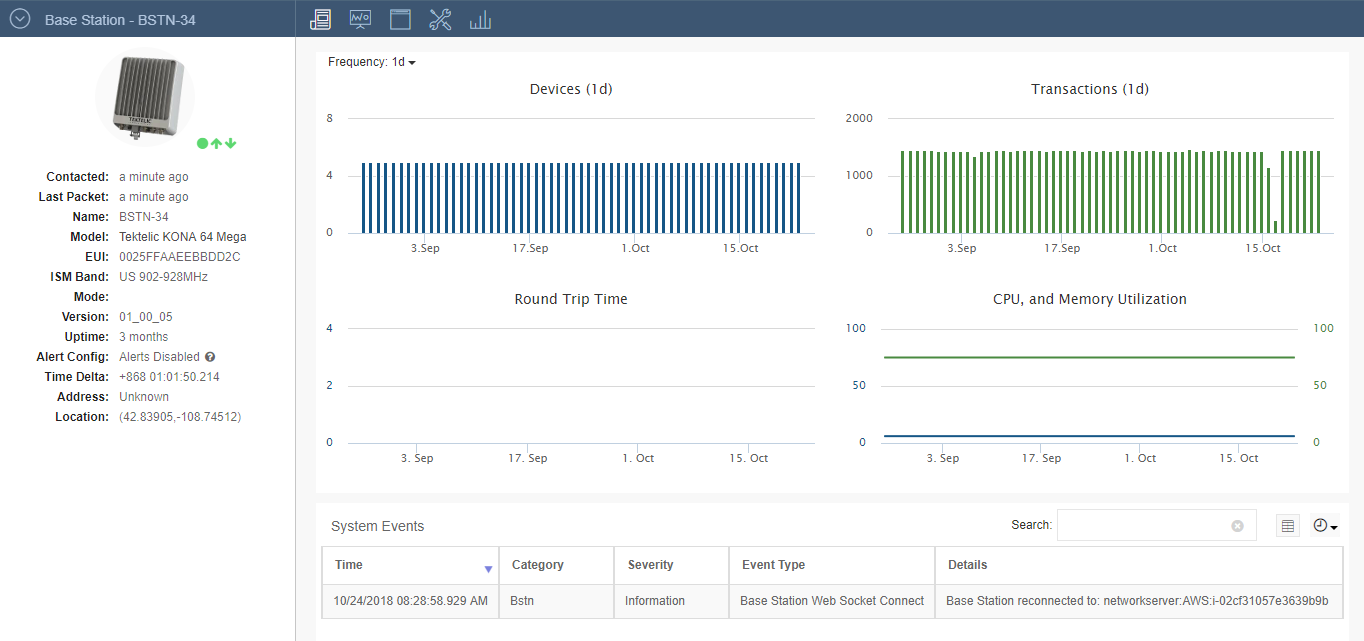
The default view and the summary of a Base Station can be seen by clicking the Summary button.

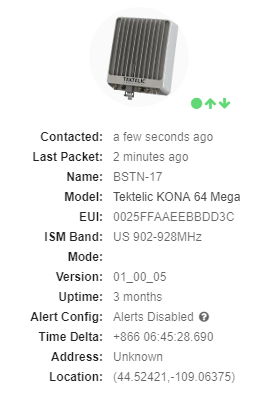
The left pane shows various Base Station details including times for last packet and contact, system uptime, GPS data, etc.
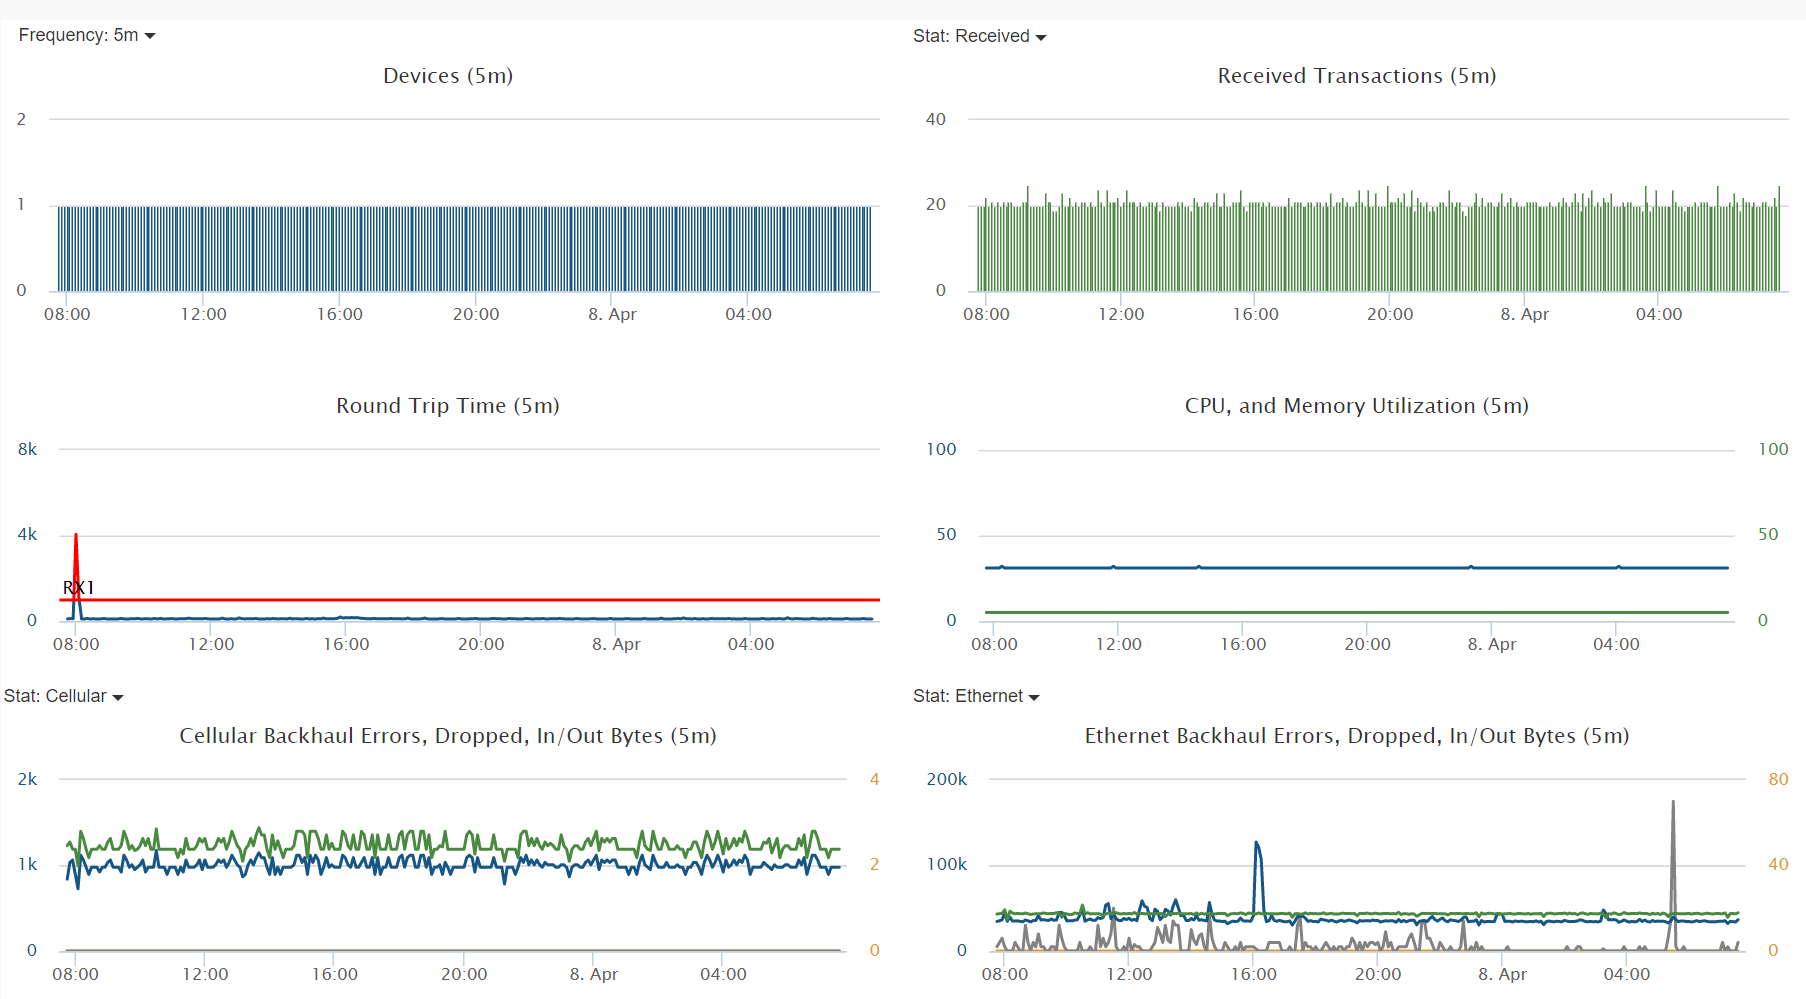
The upper right pane contains numerous charts of important statistics used to help diagnose the status of the Base Station. These include:
| Devices | Displays historical counts of the devices heard by the Base Station. |
| Received Transactions | Displays the number of successfully received transactions from the Base Station |
| Filtered Transactions | Displays the sum of the count of uplinks which were dropped at the Base Station due to Net ID filtering and Join whitelist filtering. Requires Base Station software 02_01_08+ |
| Server Filtered Transactions | The network Server Filtered Transactions are the join requests for shared join servers, and uplinks on shared NetIDs that are not allowed to be processed from of a Base Station due to participation or lack of participation in the Senet LVN. |
| Discarded Transactions | Displays the number of uplinks which were discarded by the Base Station due to LoRa Radio Errors, and Packet Errors.
|
| All Transactions | Displays the Received, Filtered and Discarded Transactions as a stacked column chart. |
| CPU and Memory Utilization | Displays historical CPU and memory use for the Base Station. |
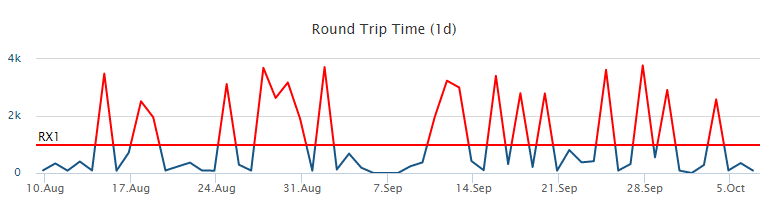
| Round Trip Time | Displays the average time to transmit and receive status messages when communicating to the Base Station. The value is computed by sending a request with the Network Server's time to the Base Station. The Base Station returns that time which is subtracted from the current time of the Network Server. In order for a response to either a Join Request or Confirmed Uplink to be sent in time, the RTT must be low enough to accommodate a one second window of time. To illustrate this the chart displays an RX1 threshold indicator. This indicator displays as a dotted gray line when RTT is within an acceptable range. If there is data outside that range the line is shown as red as well as all data that crosses that threshold. |
| Backhaul Statistics | Displays historical counts of errors, dropped uplinks, and in bytes and out bytes for either Ethernet or Cellular backhaul connections. |
Round Trip Time Threshold Violation Example:
A Base Station that is communicating as expected with the Network Server has RTT values that fall below the RX1 threshold indicator as shown here:
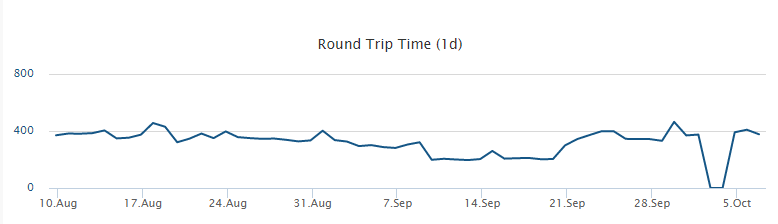
When the RTT exceeds the RX1 threshold, the chart displays the line in red, indicating a communication issue:
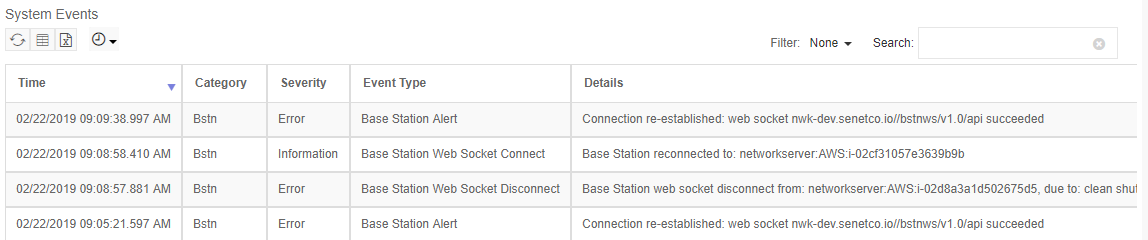
The System Events table in the lower right pane shows the Base Station's operational events, e.g. disconnects and reconnects to the Network Server.
RF Statistics
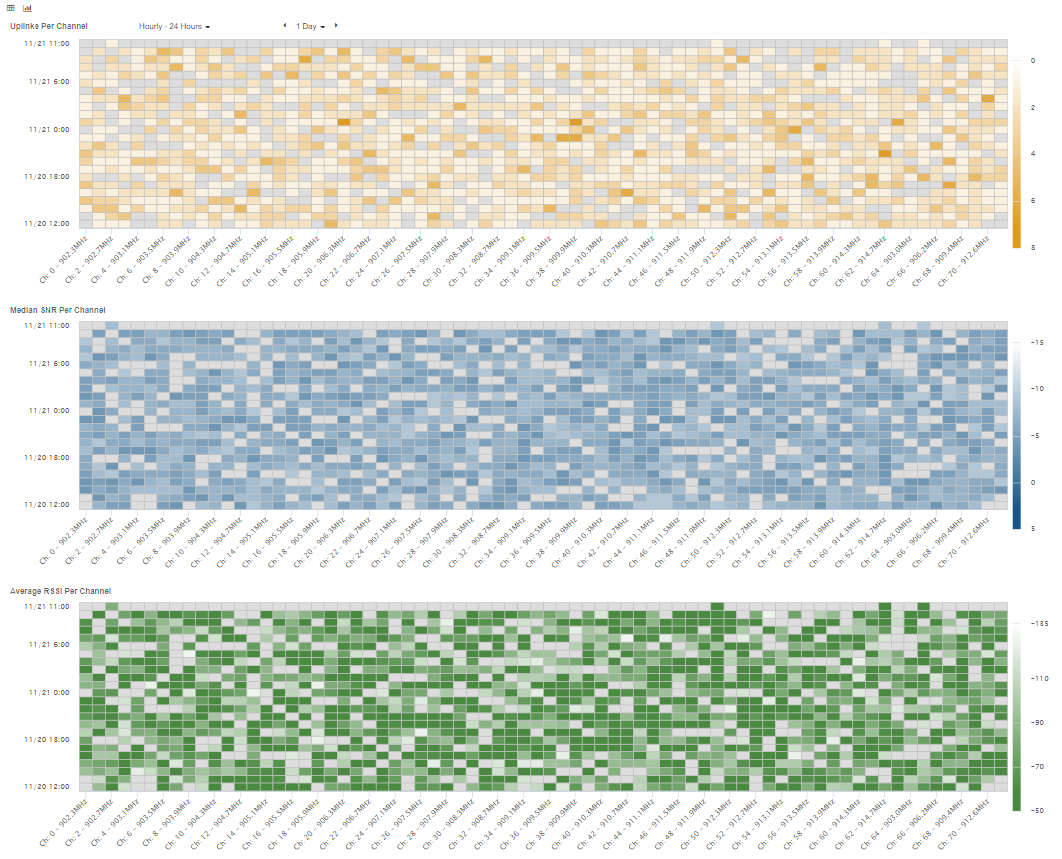
The RF Statistics page  displays a heat map for the following RF parameters over time. Median SNR Per Channel, Average RSSI Per Channel, and Uplinks Per Channel.
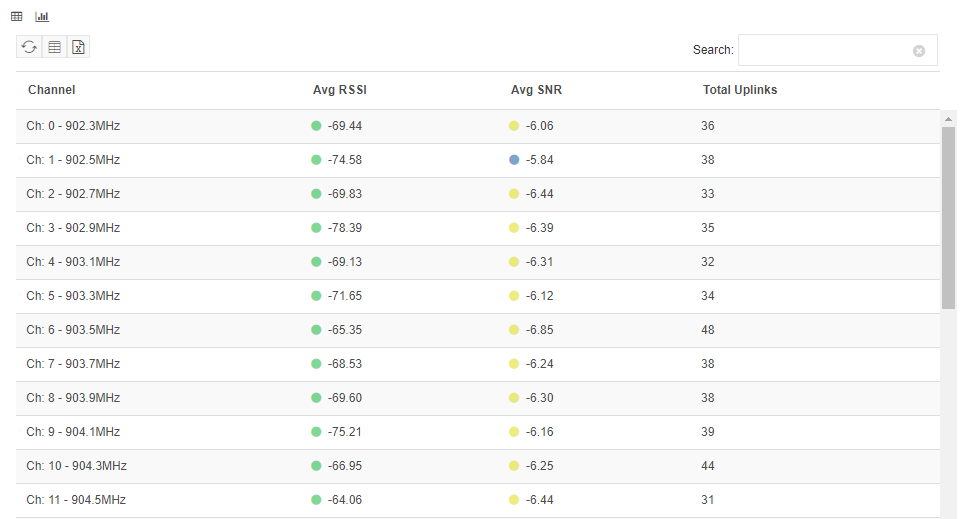
A summarized version of the RF Statistics can also be viewed as a table. The statistics are average values for collected data over the specified time frame. The averages exclude time intervals where no data was collected.
Events
The Events  view provides detailed insight into the LoRa events associated with Device communications with the Base Station. Two sub-views are presented, the LoRa Events view and the Join Errors view.
LoRa Events
The LoRa Events view shows all the uplinks and downlinks successfully processed by the Base Station along with the packet details.
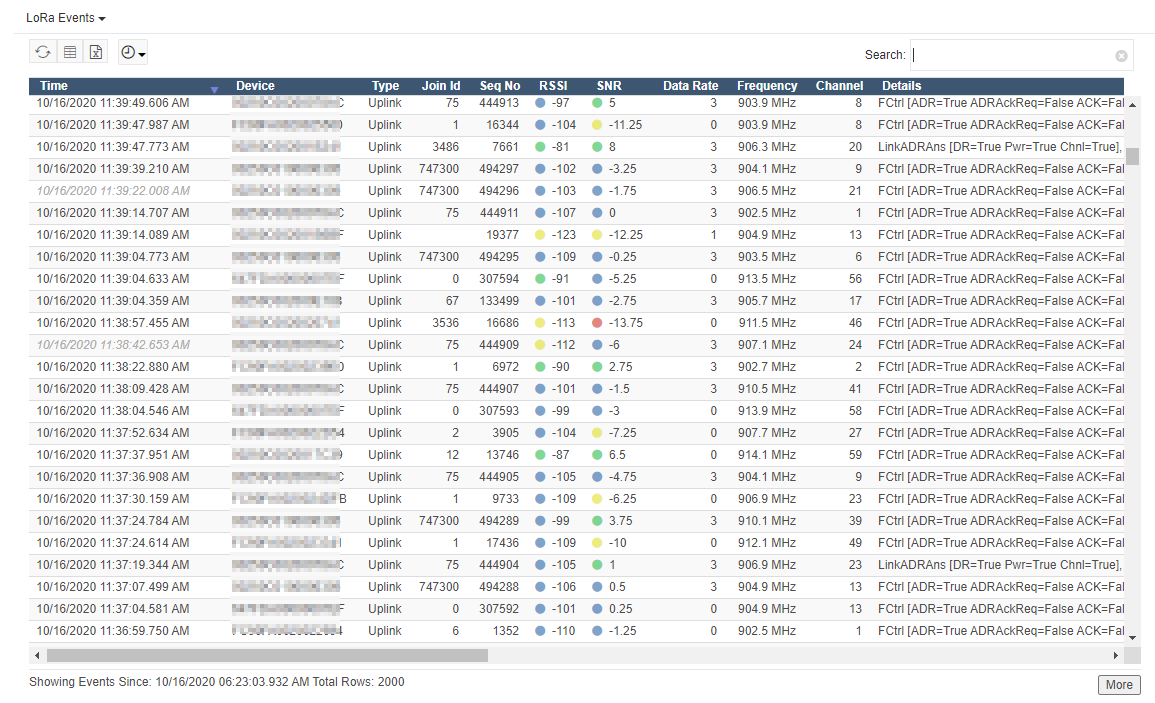
Note: The RSSI and SNR columns include color-coded icons to reflect the strength and quality of uplinks from each Device. The following table provides the meaning of each color along with the corresponding value-range. When hovering over an icon, this text will be displayed as a tooltip. Events that are received late are specifically identified with light italicized text in the Time column.
| Color | RSSI | SNR |
|---|---|---|
| Green | Very Good RSSI: >= -95 | Very Good SNR: >= 1 |
| Blue | Good RSSI: > -110 and < -95 | Good SNR: >= -6 and < 1 |
| Yellow | Fair RSSI: >= -125 and < -110 | Fair SNR: >= -13 and < -6 |
| Red | Poor RSSI: < -125 | Poor SNR: < -13 |
Date/Time Filtering:
Events can be filtered to those that occurred at a specific point in time using the Date/Time filter. Click the  button to open the limit and Date/Time filtering options for the view.
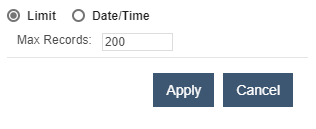
The options popup has two modes, a row limiting mode and a Date/Time filter mode. The row limit mode is used to define the number of events that are returned from the server. Limiting the number of rows returned generally improves data processing performance.
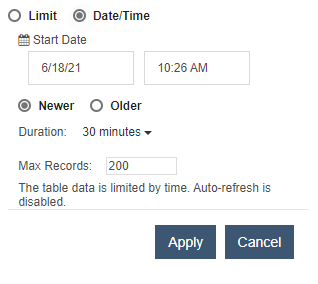
As noted, the Date/Time filtering mode is used to filter events to a specific point in time. Selecting a date and time, determines the starting point for the events that will be returned. The Duration value determines the maximum amount of time from the specified start time that events will be returned.
For example, starting at 7 a.m. with a duration of 1 hour will return events that occurred between 7 a.m. and 8 a.m if "Newer" is selected. Otherwise if "Older" is selected, events from 7 a.m. to 6 a.m. will be returned. Since the number of events that occur within a specified timeframe is variable, the Max Rows value is used to further limit the returned data.
Auto Refresh
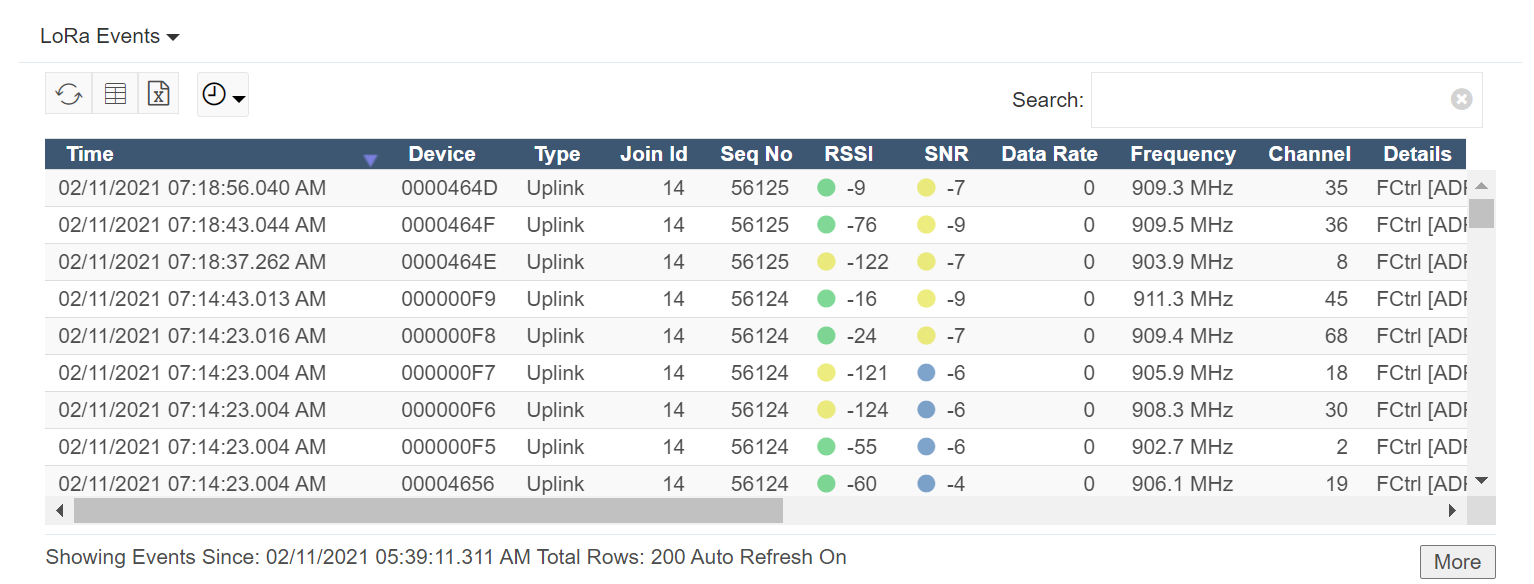
By default, the Events table appends new events periodically every 30 seconds. This behavior is disabled when either a Date/Time filter is applied or the view is scrolled to a position other than the top of the table. Auto-refresh is re-enabled when either the view is refreshed or the view is scrolled back to the top.
An indication of the auto refresh status is displayed in the Event table's footer as shown here:
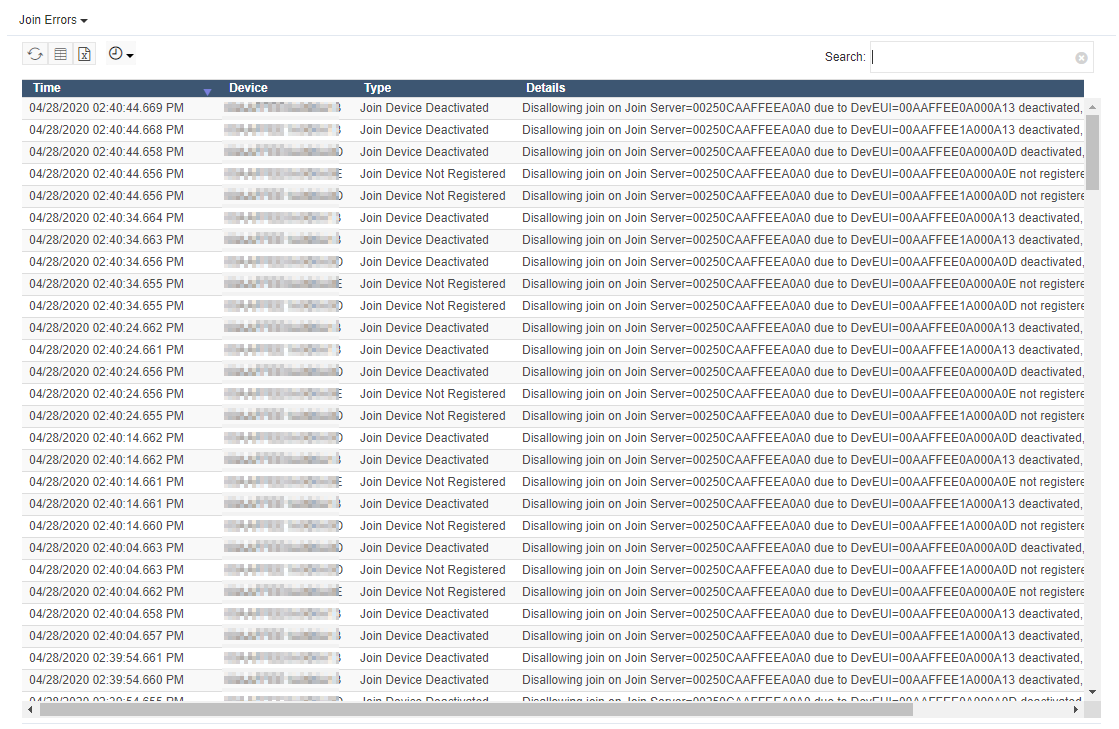
Join Errors
The Join Errors view shows information about LoRa events that are discarded by the Base Station such as failed join attempts. This view assists in troubleshooting Device connection issues.
Devices
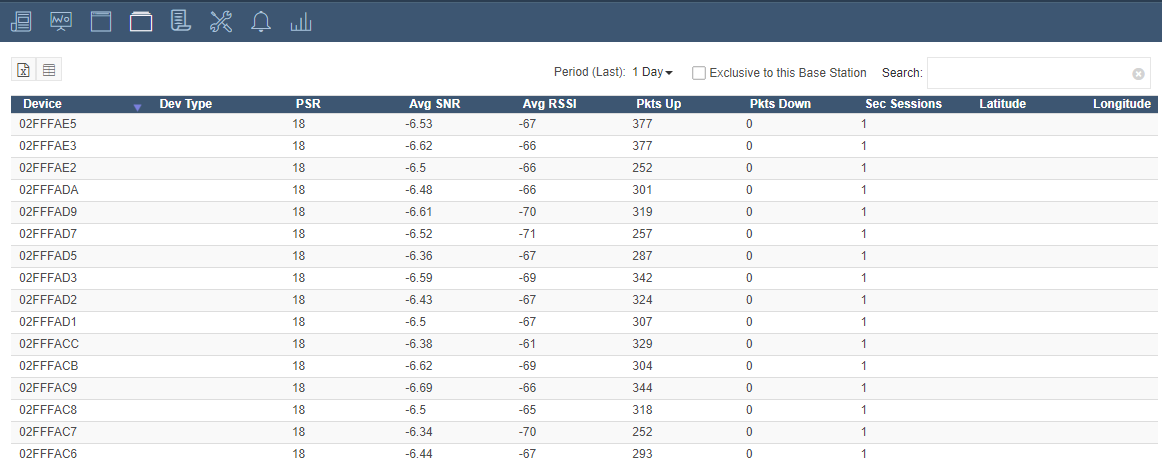
The Devices ![]() view displays a historical view of Devices heard by a Base Station. The view provides a consolidated view of the Device RF statistics and location information for Devices heard by the Base Station within the specified period. The list of Devices can be further scoped to only the Devices exclusively heard by the Base Station. This view assists in troubleshooting Device communications with the selected Base Station.
view displays a historical view of Devices heard by a Base Station. The view provides a consolidated view of the Device RF statistics and location information for Devices heard by the Base Station within the specified period. The list of Devices can be further scoped to only the Devices exclusively heard by the Base Station. This view assists in troubleshooting Device communications with the selected Base Station.
Base Station Diagnostics
Base Station Diagnostics  help understand a problematic Base Station.
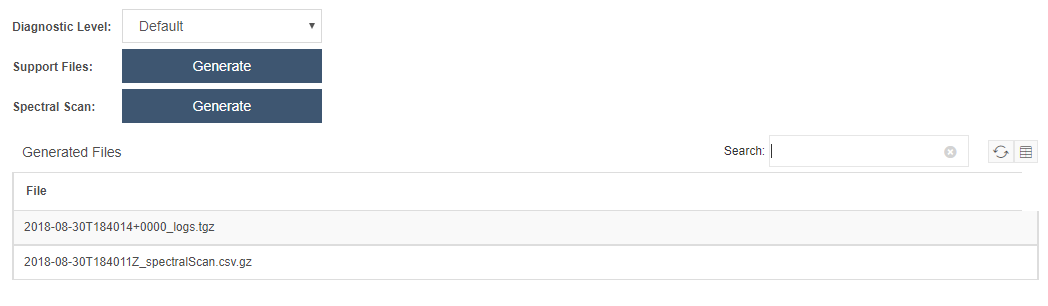
If running the latest compatible Netmore Base Station software, Support Files and Spectral Scans can be generated along with setting the information level on a Base Station.
Additional diagnostic information is displayed in the Basic and Advanced Diagnostics sub-views. Content in these views is hardware and firmware dependent and will vary between different Base Stations.
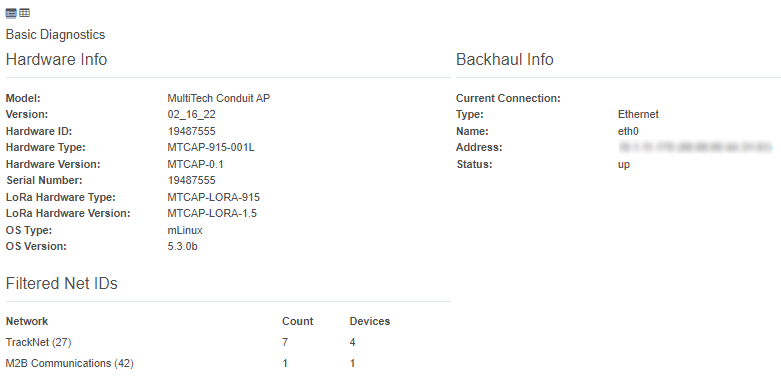
The Basic Diagnostics view displays critical Hardware, Backhaul and GPS information in a panel layout for quick reference.
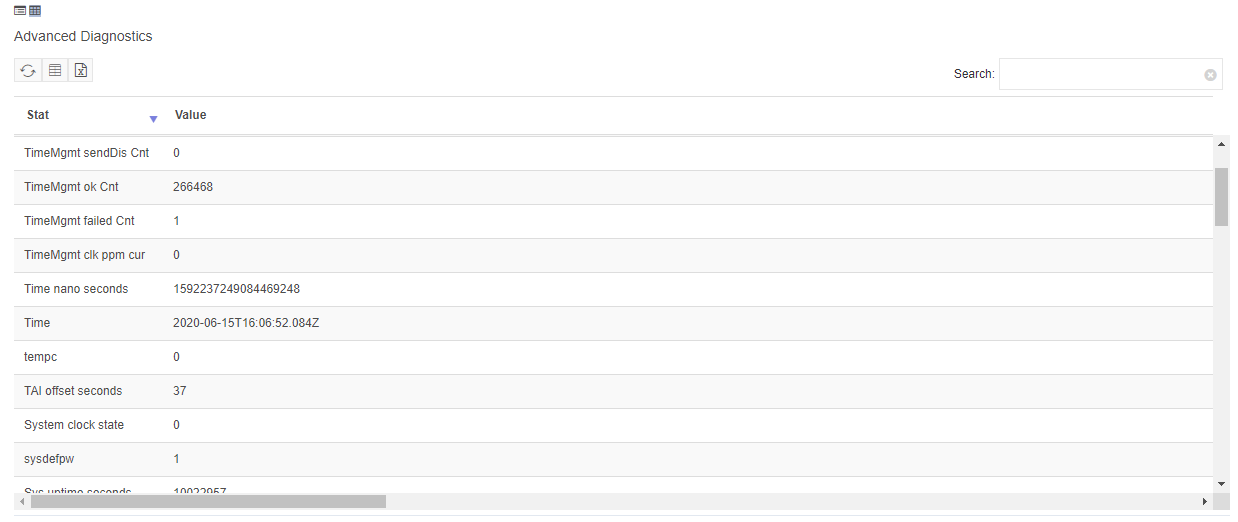
The Advanced Diagnostics view displays all available Base Station data in tabular format. Displayed values may contain nested JSON data that may be relevant to more sophisticated users.
Alerts and Cases
Click on the  button to show a consolidated view containing the Base Station Availability chart, the list of Active and Recent alerts related to the Base Station and a list of Cases.
Note
This button is only available if Alerts have been enabled on the Base Station.
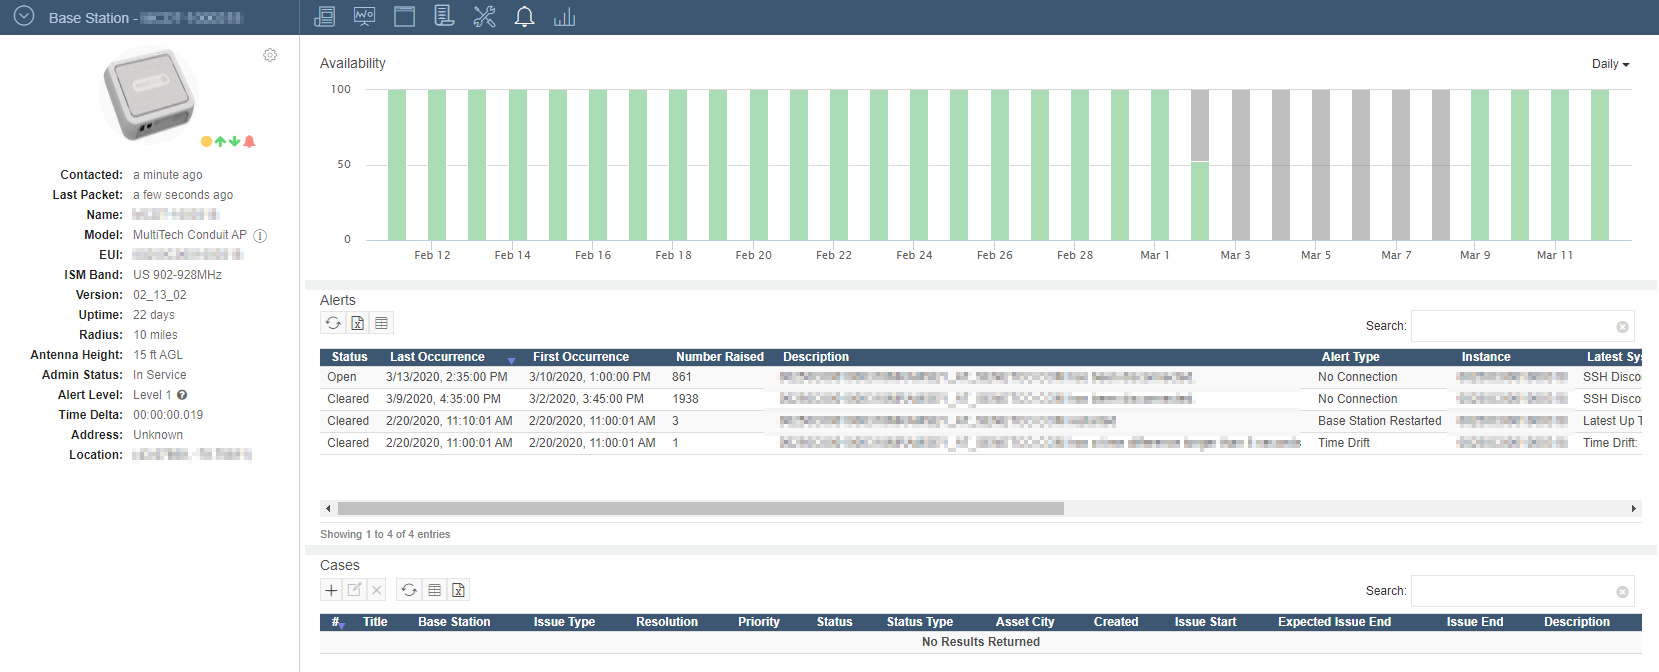
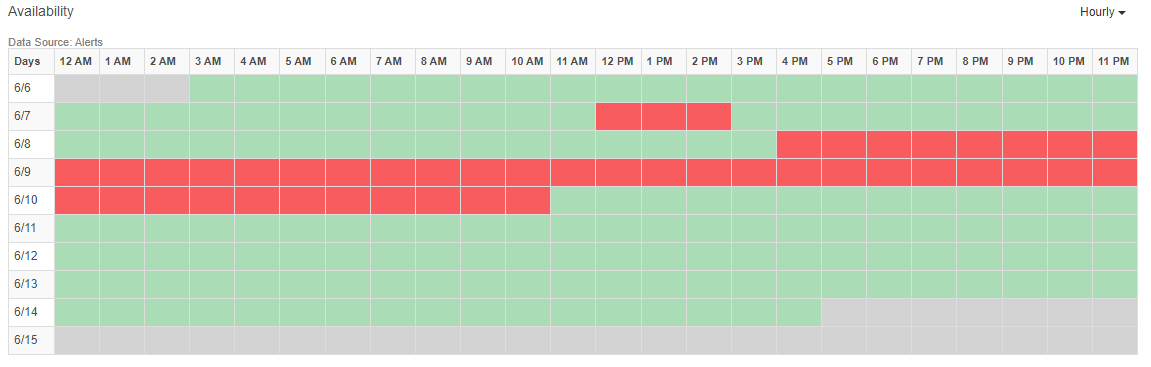
Availability
The Availability chart shows Hourly, Daily and Monthly breakdowns of Base Station availability. Availability is determined by the absence of communication from a given Base Station. Base Stations communicate status every minute. If less than 60% of the status messages are received in a 5 minute period, the Base Station is marked as unavailable.
In this example, the hourly Availability report shows that the Base Station was unvailable on 6/7/2021 between 12 PM and 2 PM.
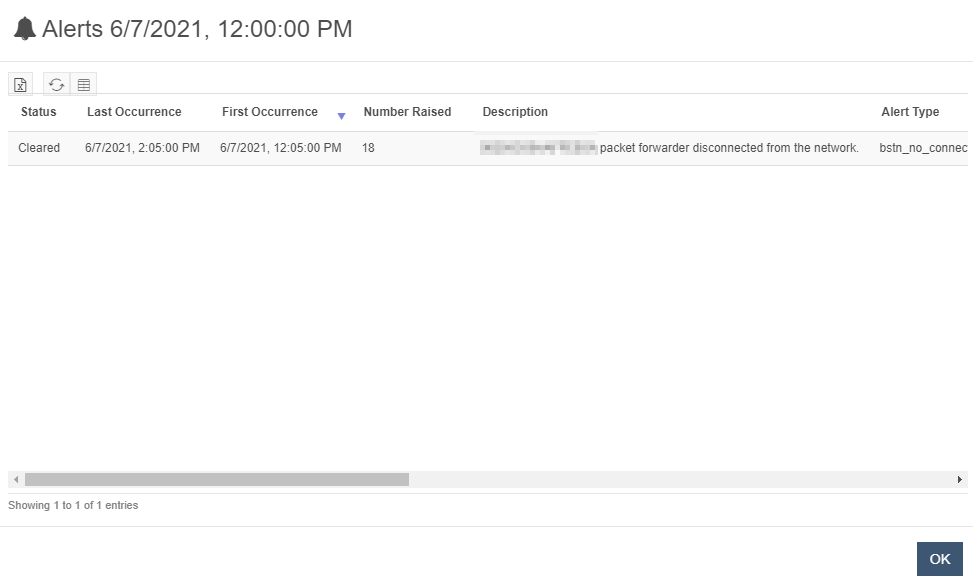
Clicking on any of the red, hourly cells in the chart launches a dialog that shows the Alert(s) related to the outage. This screenshot of the dialog shows that there was a packet forwarder disconnect starting at 12:05 PM on 6/7/21 and ending at 2:05 PM. The issue was addressed and the Availbility returned to 100% until the next outage on 6/9/2021.
Site Info
Click on the  button to view the Site, Registration, Contacts, Lease or Internet Connection information related to the Base Station.
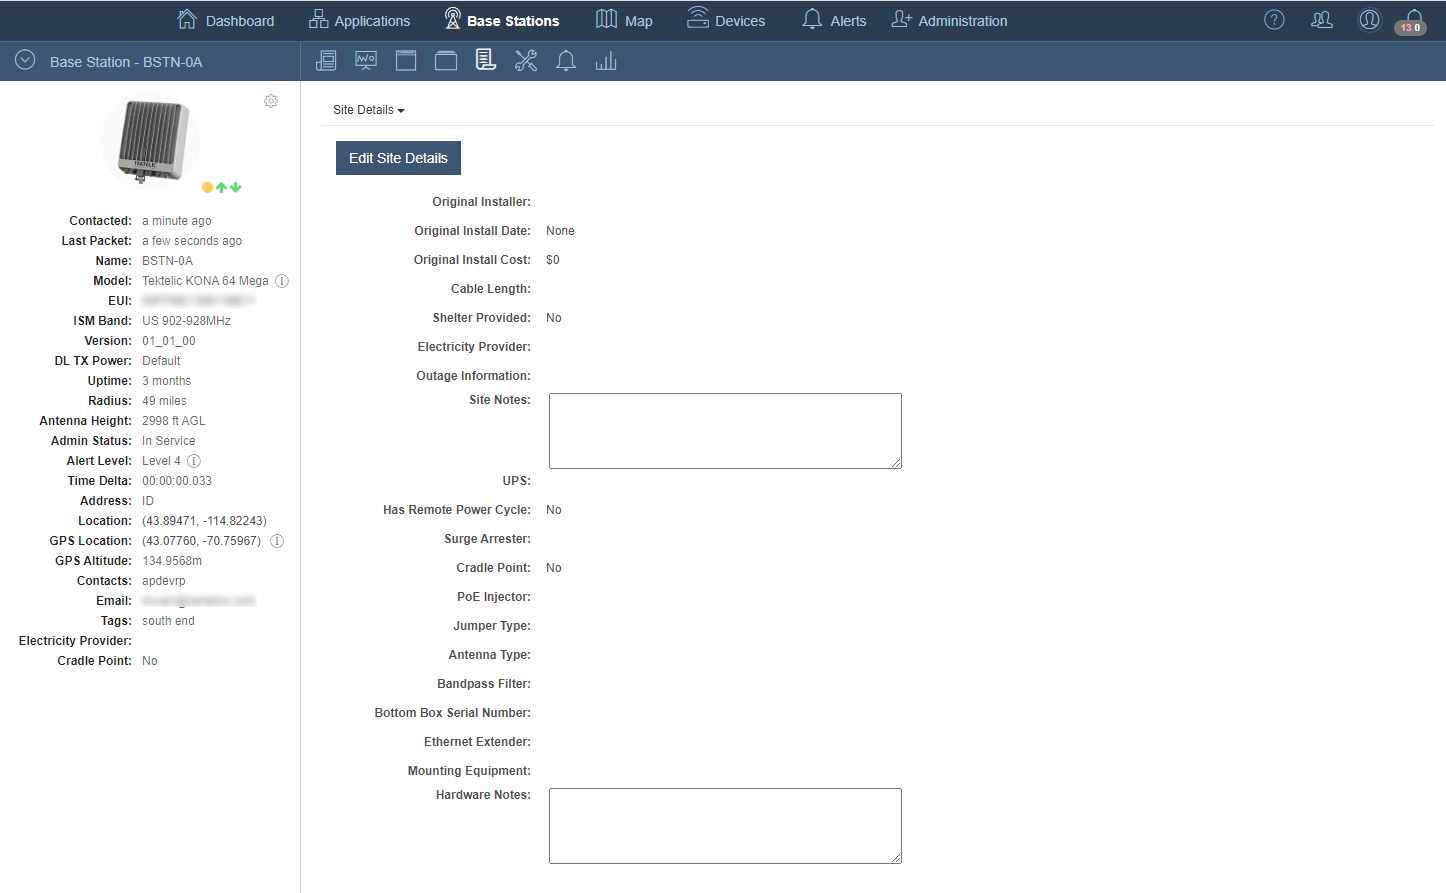
Site Details
The Site Details view shows details of the Base Station installation. This includes information about who installed the Base Station, how much it cost to install and when the installation occurred.
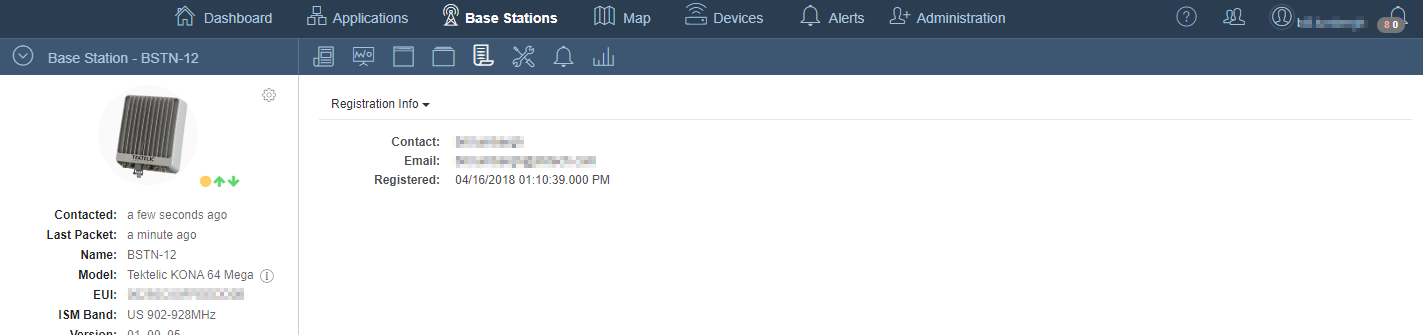
Registration Information
The Registration Information view shows Base Station information collected at the time of registration. This includes the original Contact information associated with the Base Station.
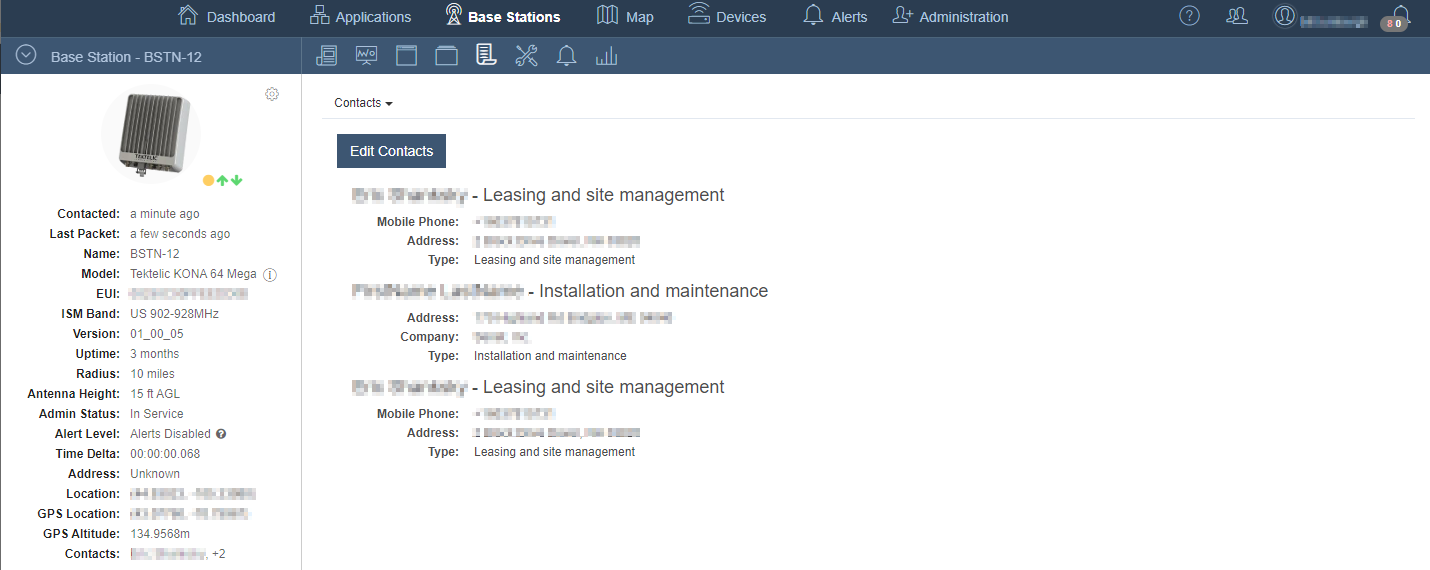
Contacts
The Contacts view provides information for personnel associated with a Base Station. Multiple resources are added through this view; for example, primary and/or secondary contacts who provide Base Station services like lease agreements or site maintenance.
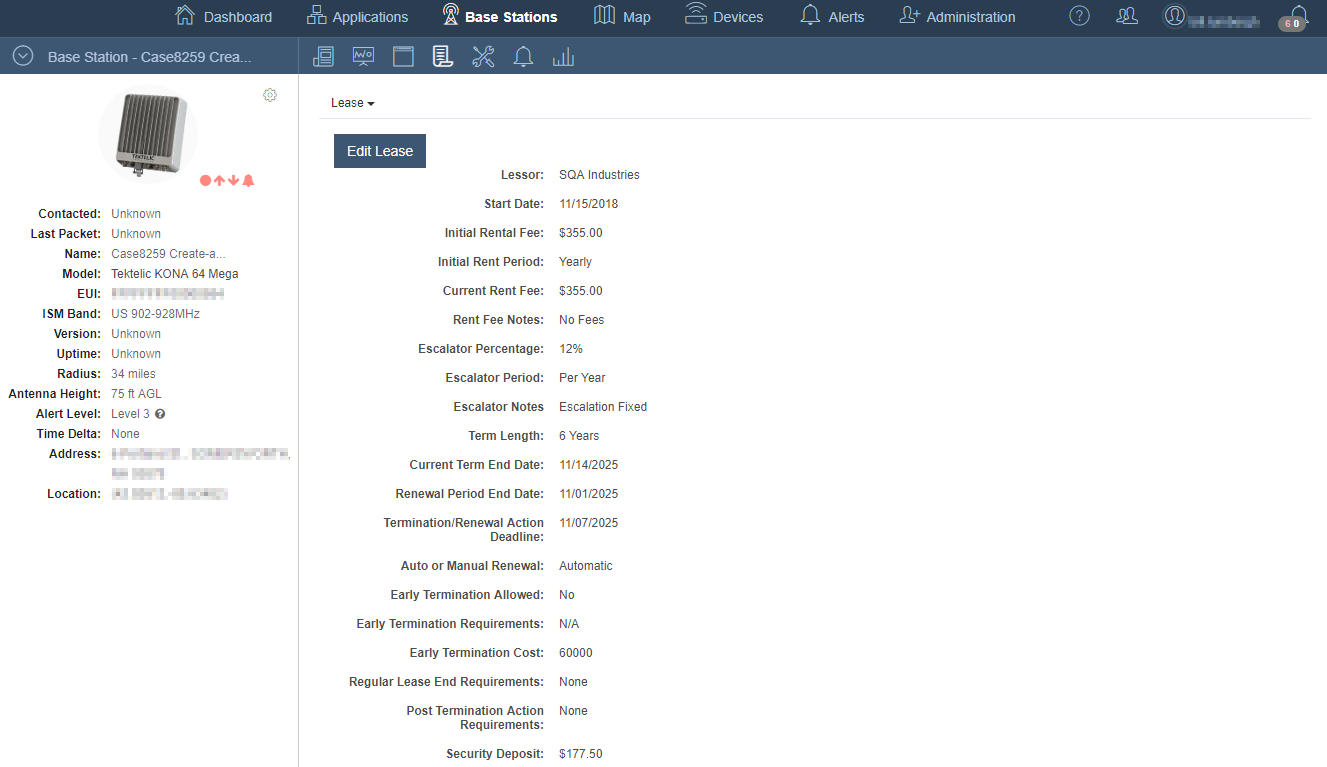
Lease
The Lease view shows the details of the contractual terms associated with a Base Station installation. This includes the critical details of the Lease such as when the Lease starts, when it ends, the rental period, the rental fee, and the name of the lessor.
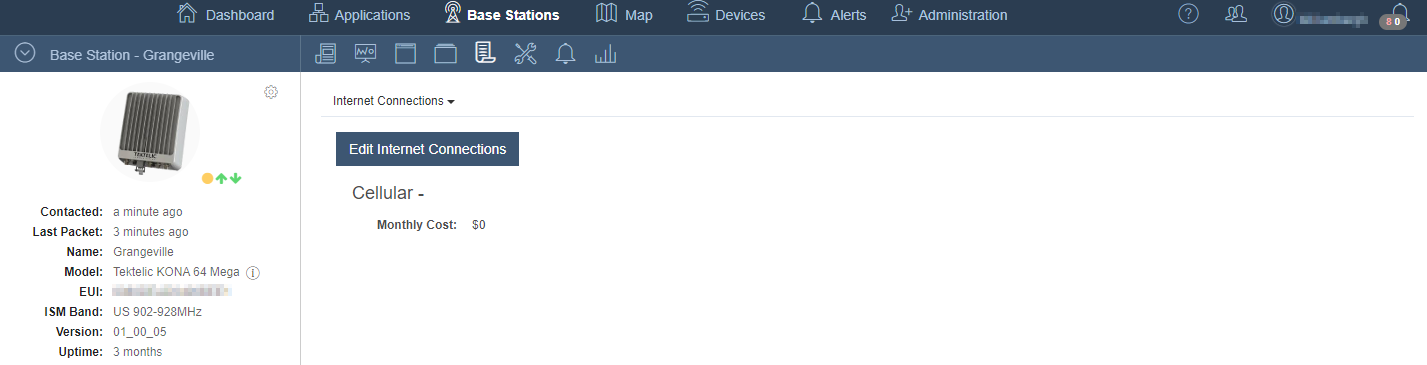
Internet Connections
The Internet Connections view provides a mechanism for viewing or editing internet connection information associated with the Base Station. This may include adding details about the type of connection, ex. Ethernet, cellular or satellite, as well as associated costs.
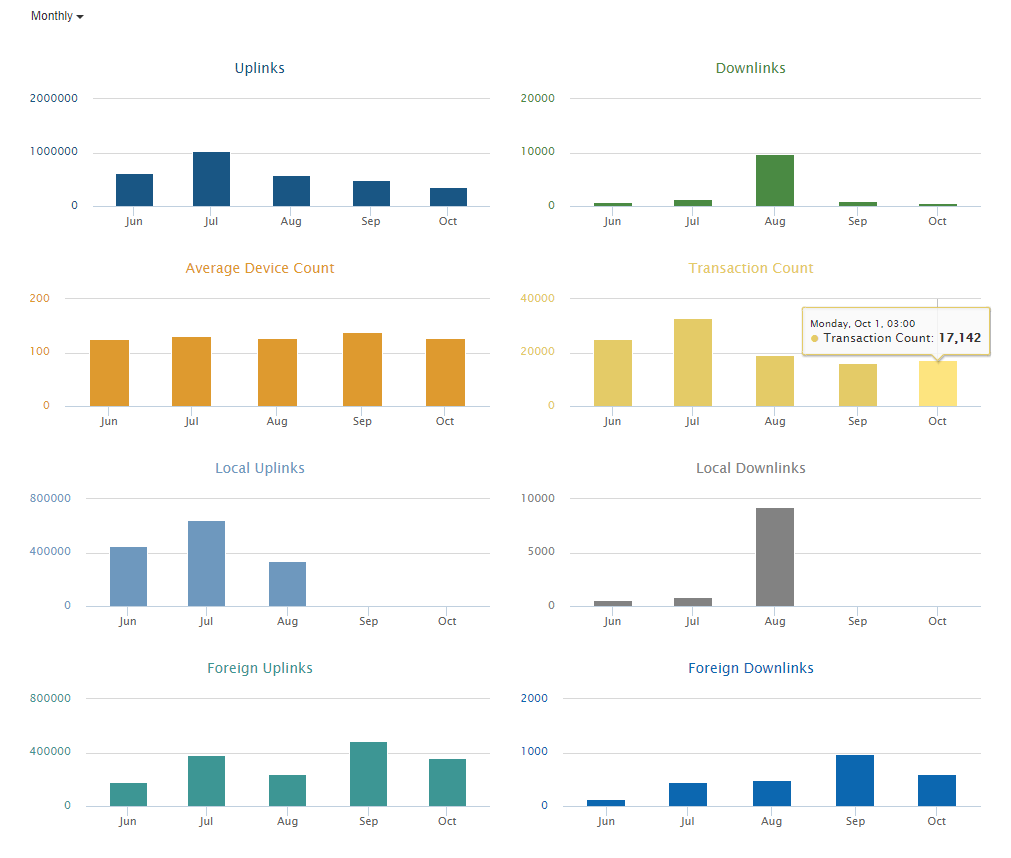
Statistics
Click on the  icon to see various transaction statistics for the history of the Base Station. Each statistic is aggregated based on the selected period, ex. Monthly, Daily, Lifetime.
| Chart | Description |
|---|---|
| Uplinks | The total number of messages forwarded by the Base Station to the Network Server. |
| Downlinks | The total number of messages forwarded by the Network Server to the Base Station. |
| Average Device Count | The calculated mean number of unique Devices heard within each aggregated time period. |
| Transaction Count | The total number of messages exchanged between the Base Station and Network Server within each aggregated time period. |
| Local Uplinks | The total number of messages forwarded by the Base Station to the Network Server for Devices with the same Account ID or contractual relationship as the Base Station. |
| Local Downlinks | The total number of messages forwarded by the Network Server to the Base Station sent to Devices with the same Account ID or contractual relationship as the Base Station. |
| Foreign Uplinks | The total number of messages forwarded by the Base Station to the Network Server from Devices with Account IDs or contractual relationships different from the Base Station's. |
| Foreign Downlinks | The total number of messages forwarded by the Network Server to the Base Station sent to Devices with Account IDs or contractual relationships different from the Base Station's. |