Planning Maps
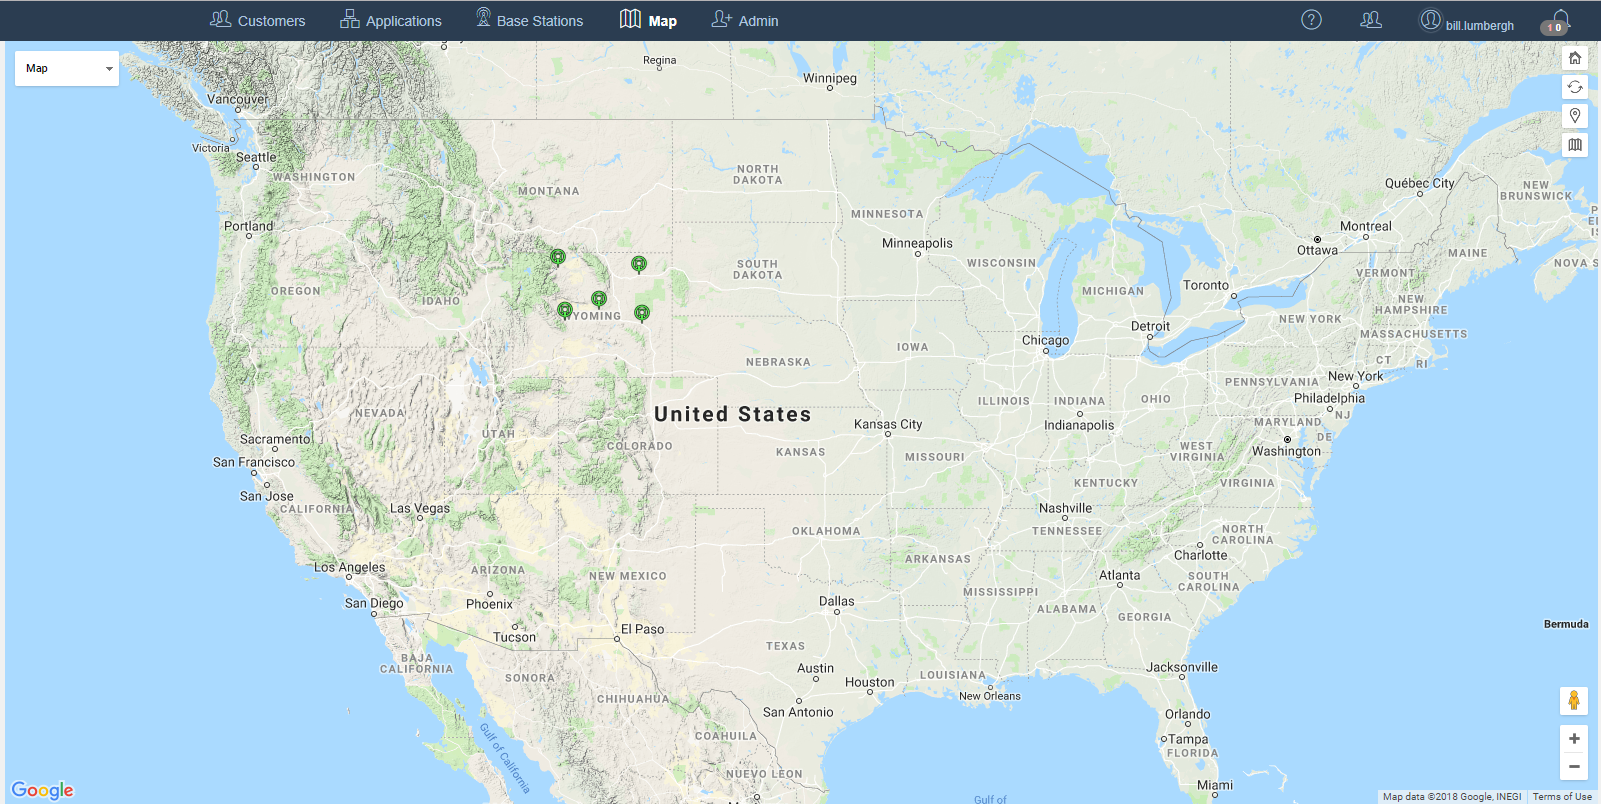
The mapping feature is used to interact with customer planning maps as well as to view Base Station viewsheds and end points statistics.
Planning maps can be used to create proposed Base Stations and end points and are useful to visually identify expected coverage areas as well as calculating the predicted path quality for end points from the Base Stations modeled in the area.
 Reset the map center and zoom
 Refresh the contents of the map
 Coverage: Show the map Coverage tool
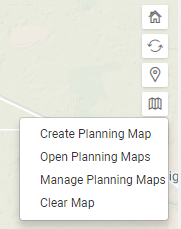
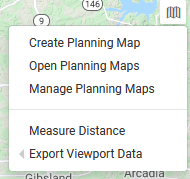
 Map Planning: Create, open or manage maps
Creating Planning Maps
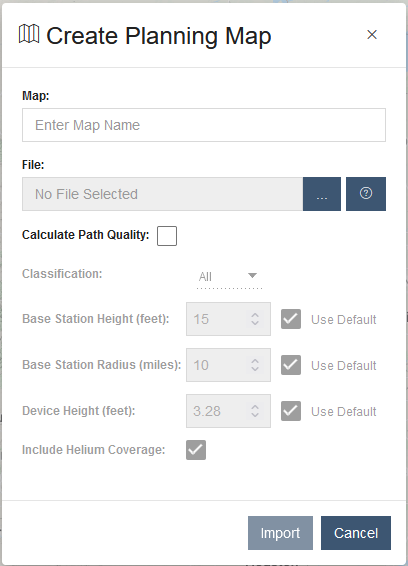
1. To create a map, select Create Planning Map from the Map Option button menu. This action will open a create planning maps form.
2. Enter a map name.
Note
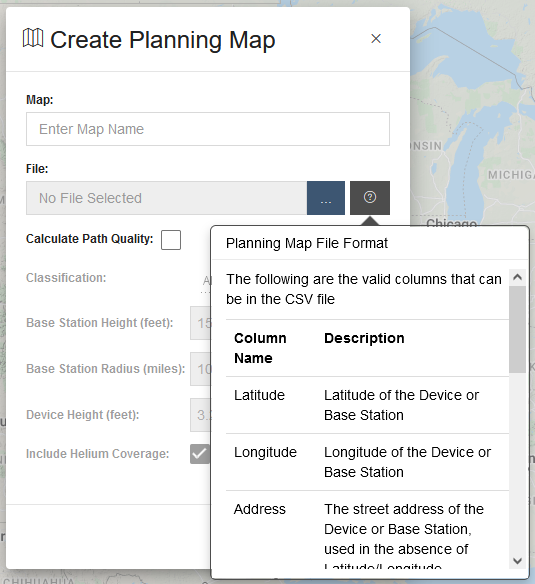
Selecting  opens a dialog that displays the valid columns for the planning map. A planning map consists of multiple columns of data including latitude and longitude location information in the decimal degrees format, ex. 42.8334, -106.35946.
The required columns for Base Stations are latitude, longitude, type, radius and height. These values are used to create a Base Station viewshed on the map.
The minimum required columns for end points are latitude and longitude only. Planning maps are saved in CSV file format.
opens a dialog that displays the valid columns for the planning map. A planning map consists of multiple columns of data including latitude and longitude location information in the decimal degrees format, ex. 42.8334, -106.35946.
The required columns for Base Stations are latitude, longitude, type, radius and height. These values are used to create a Base Station viewshed on the map.
The minimum required columns for end points are latitude and longitude only. Planning maps are saved in CSV file format.
Note
By selecting the “Calculate Path Quality” entry, a path quality analysis with be performed for each endpoint location based on the projected viewshed of Base Stations in the area. Base Stations and proposed Base Stations in the imported file contribute to the path quality calculation. The Path Quality Settings for the calculation can be configured here.
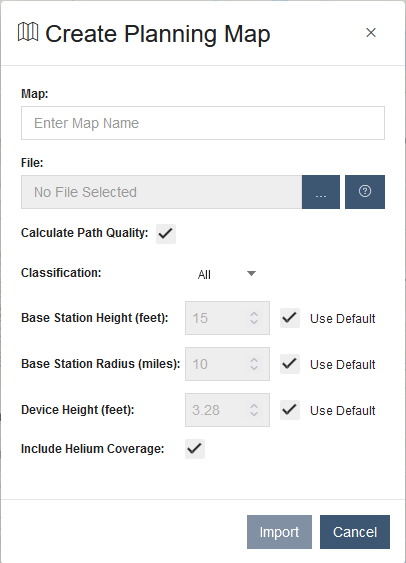
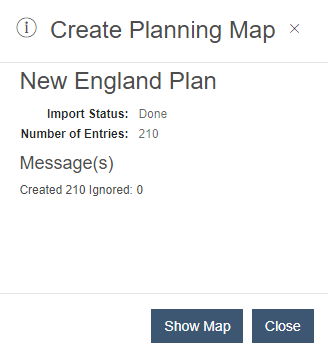
3. Selecting  will open the local computer file explorer to select the desired planning map that has previously been created. For this example, the file “Customer_Location_mapversion” was selected. Click the “Import” button to import the planning map into the mapping tool.
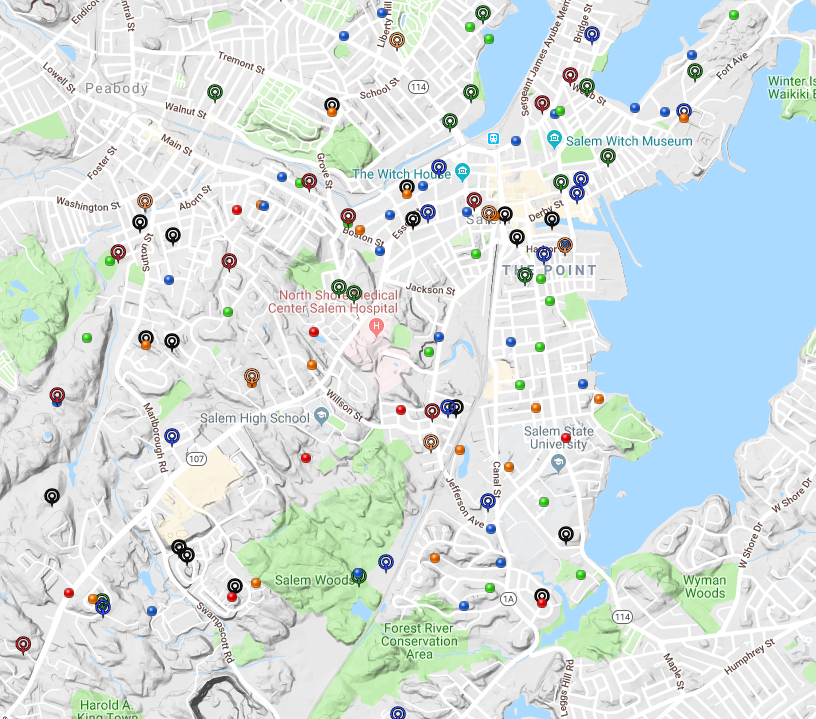
4. Selecting “Show Map” results in the mapped objects being displayed on the planning map location. This encompasses all the end point pin locations in the respective view.
Planning Map Fields
| Column | Description | Optional |
|---|---|---|
| Latitude | The latitude of the entry | |
| Longitude | The longitude of the entry | |
| Address | The address of the entry. This will be used to get the latitude and longitude if not specified. | |
| PathQuality | The path quality value associated with the entry. |  |
| Description | A description for the entry. | |
| Type | Either Device Or Base Station (If left blank Device type will be used). | |
| Marker | The icon ID of a marker you wish to use instead of the default one. | |
| Radius | The range of the Base Station in miles if the type selected is Base Station. | |
| Height | The height of the Base Station in feet if the type selected is Base Station. | |
| PQ Bstn 1 EUI | The EUI of the Base Station that gave the best path quality results for the given row | |
| PQ Bstn 1 pathQuality | The path quality result provided by PQ Bstn 1 in decimal percentage. | |
| PQ Bstn 1 Distance | The distance between the entry and PQ Bstn 1 in miles. | |
| PQ Bstn 1 Height | The height of PQ Bstn 1 in feet. | |
| PQ Bstn 1 Azimuth | The Azimuth heading between the entry and PQ Bstn 1 in decimal degrees. | |
| PQ Bstn 2 EUI | The EUI of the Base Station that gave the second best path quality results for the given row | |
| PQ Bstn 2 pathQuality | The path quality result provided by PQ Bstn 2 in decimal percentage. | |
| PQ Bstn 2 Distance | The distance between the entry and PQ Bstn 2 in miles. | |
| PQ Bstn 2 Height | The height of PQ Bstn 2 in feet. | |
| PQ Bstn 2 Azimuth | The Azimuth heading between the entry and PQ Bstn 2 in decimal degrees. | |
| PQ Bstn 3 EUI | The EUI of the Base Station that gave the third best path quality results for the given row | |
| PQ Bstn 3 pathQuality | The path quality result provided by PQ Bstn 3 in decimal percentage. | |
| PQ Bstn 3 Distance | The distance between the entry and PQ Bstn 3 in miles. | |
| PQ Bstn 3 Height | The height of PQ Bstn 3 in feet. | |
| PQ Bstn 3 Azimuth | The Azimuth heading between the entry and PQ Bstn 3 in decimal degrees. | |
Exporting Planning Maps
Planning Maps can be exported through the Planning Maps table. Simply select on a row by selecting on the name field. Then click the export  button. This exports a map in the same format that it was imported so that it can be shared or re-imported. As part of the export, the best 3 Base Stations that contributed to the last Planning Map path quality calculation are included for each entry. This provides the path quality, distance, height, and Azimuth that was measured for that Base Station when compared to that map entry.
Planning Map Marker Images
| Image | Marker ID |
|---|---|
 |
bluecircle |
 |
lightbluecircle |
 |
yellowcircle |
 |
greencircle |
 |
lightgreencircle |
 |
redcircle |
 |
pinkcircle |
 |
orangecircle |
 |
lightorangecircle |
 |
graycircle |
 |
darkgraycircle |
 |
lightgraycircle |
 |
towergreen |
 |
towerred |
 |
towerblack |
 |
towerblue |
 |
towerorange |
| --- |
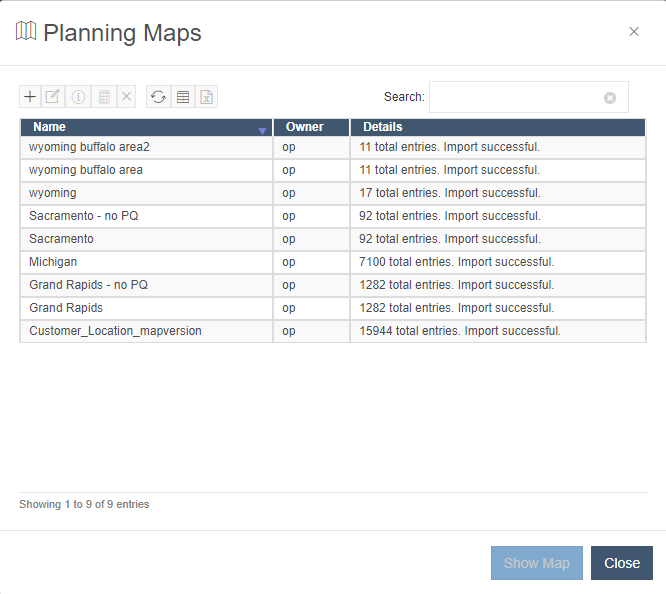
Managing Planning Maps
Selecting “Manage Planning Maps” displays the planning maps summary table below.
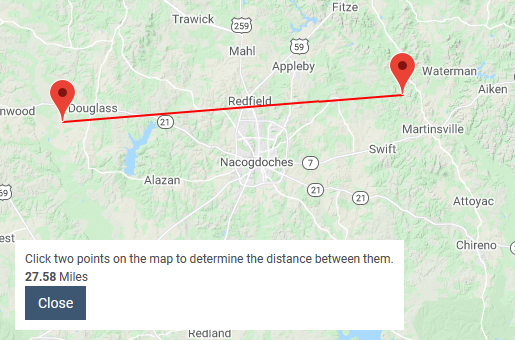
Measuring distance
The map provides the ability to quickly measure the distance between two points on the map. Click the button and then select "Measure Distance" from the menu to enable the feature.
Then select two points on the map and see the distance in miles between them. This disables all other clickable elements so that any two points can be selected without triggering other map features. Clicking close will remove the two markers, the line, and the distance dialog.
Base Station Deployment Planning
Using the planning maps a user can easily search for a structure to be used for a Base Station deployment.
First go to the Maps Tab and zoom into an area where coverage is needed to be deployed.
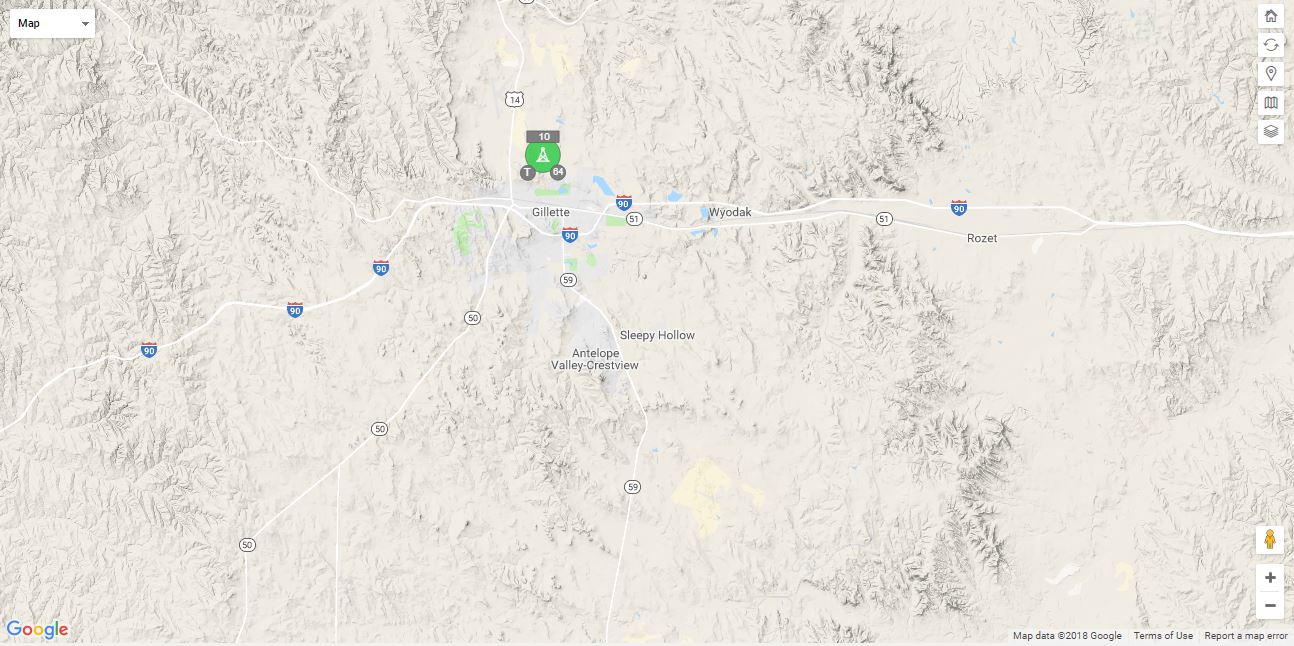
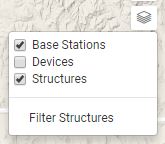
Click the layers button and select Structures. This will plot all available structures in the area.
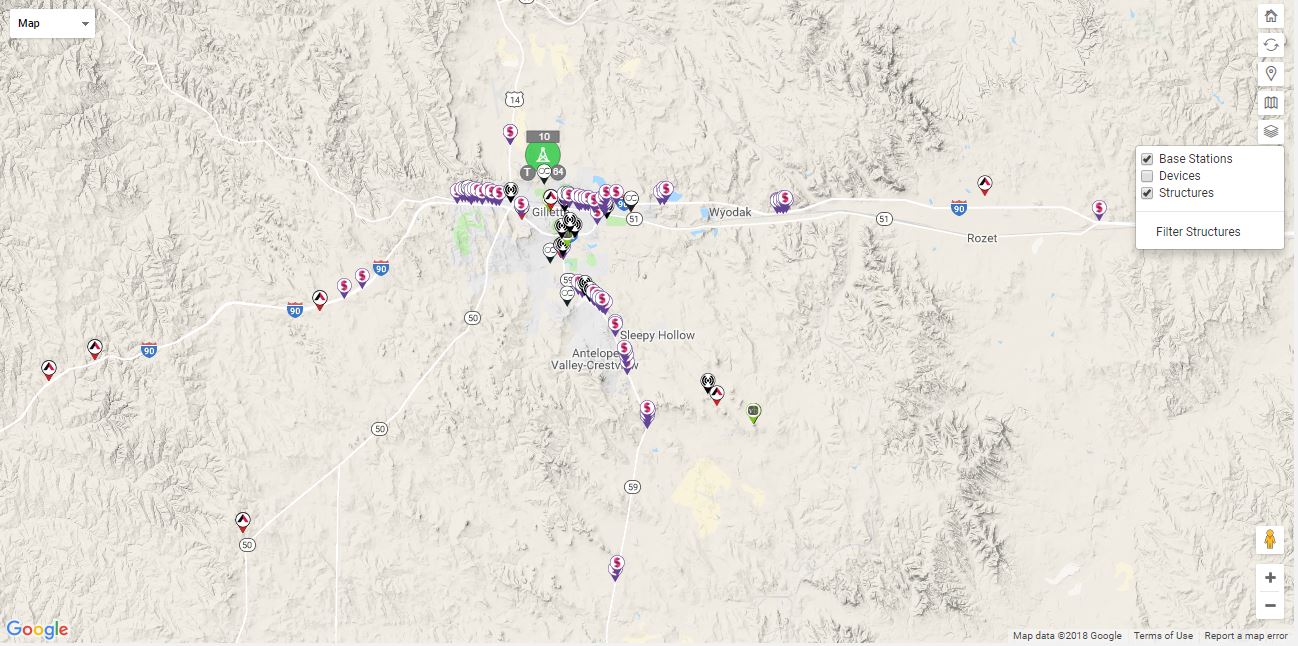
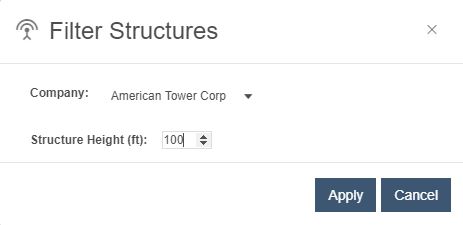
Click the layers button again, then click Filter Structures. This allows filtering of the displayed structures to a particular company or a structure greater than a specified height. In the case below we filtered to see only American Tower Corp Structures greater than 100ft high.
The map will now show only the filtered towers.
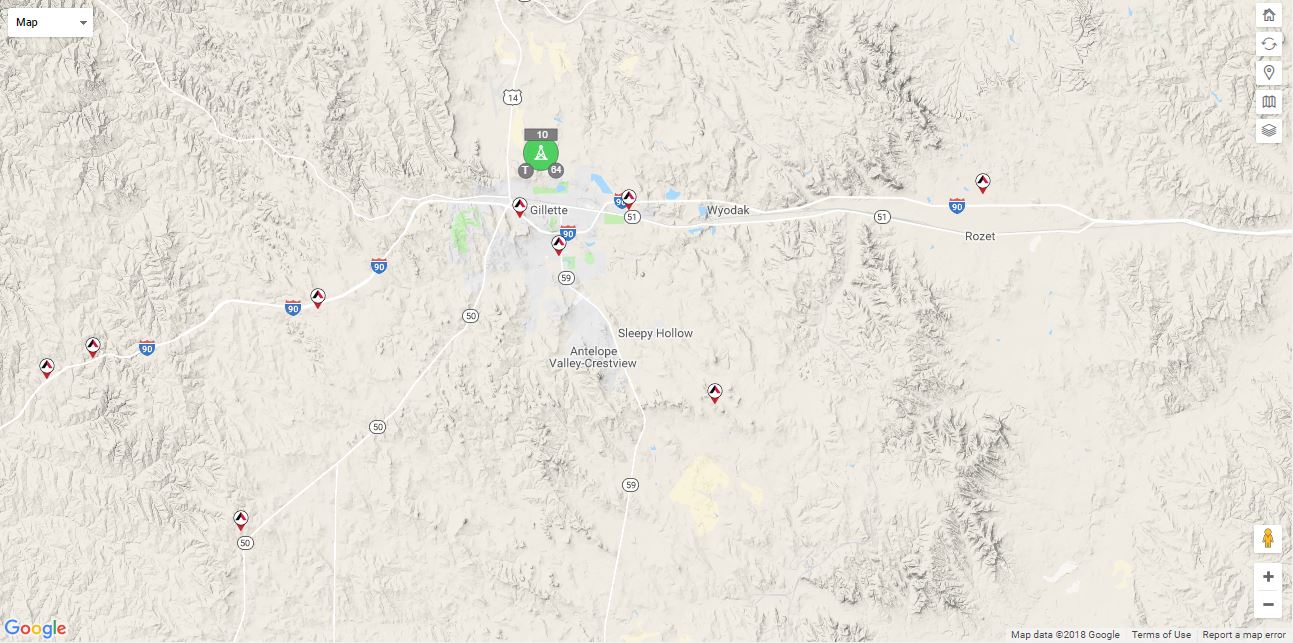
This filtered set displays the structures that meet the deployment requirements.
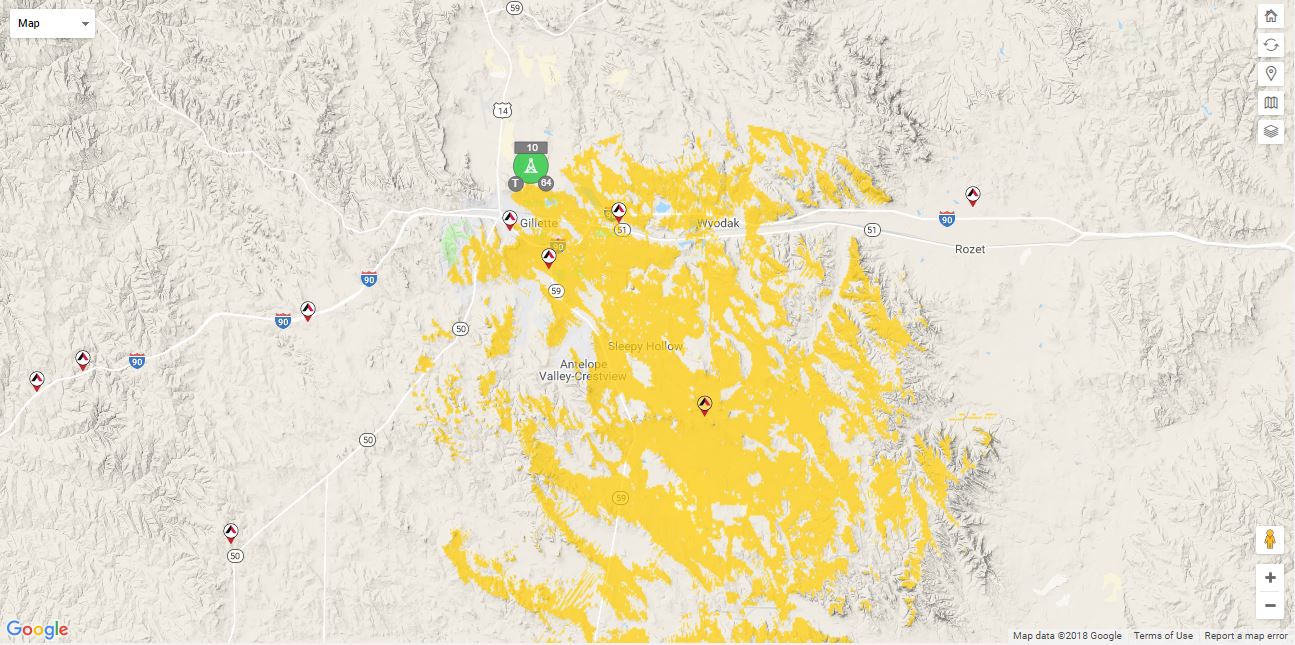
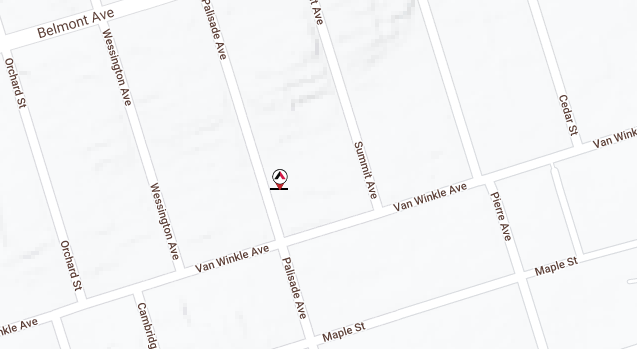
Left clicking the tower will display a theoretical coverage of the tower. The coverage area displayed is a 10 mile Radius at the max structure height.
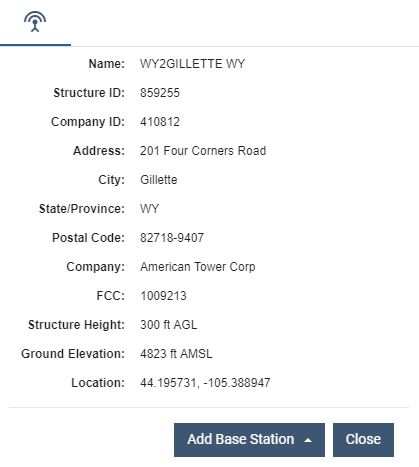
Once a desired structure is located, right click the structure to see more detailed information related to that structure.
Multiple Structures at the Same Location
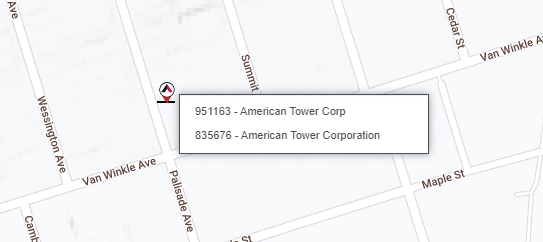
Structures appearing at the same geographic location within 5 significant decimal places for latitude and longitude are now marked on the map with a footer image.
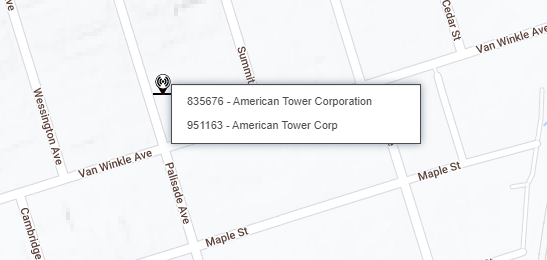
Hovering over a group of Structures displays a tooltip listing the Structures at that location. The first item in the tooltip shows the Structure that is visible in the Map.
Clicking on the item for any other Structure promotes that Structure to the top.
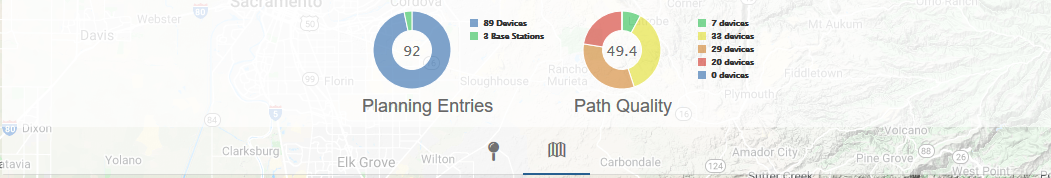
Planning Map Statistics
When a Planning Map is active, a statistics header is added to the map. This header shows Entry and Path Quality statistics for the Planning Map. The Entries statistic shows the breakdown of Devices and Base Stations included on the Planning Map. The Path Quality statistic shows threshold groupings by Path Quality of all Devices on the Map.
Coverage Tool
The Coverage Tool button launches a dialog that contains a search field for entering addresses or locations.
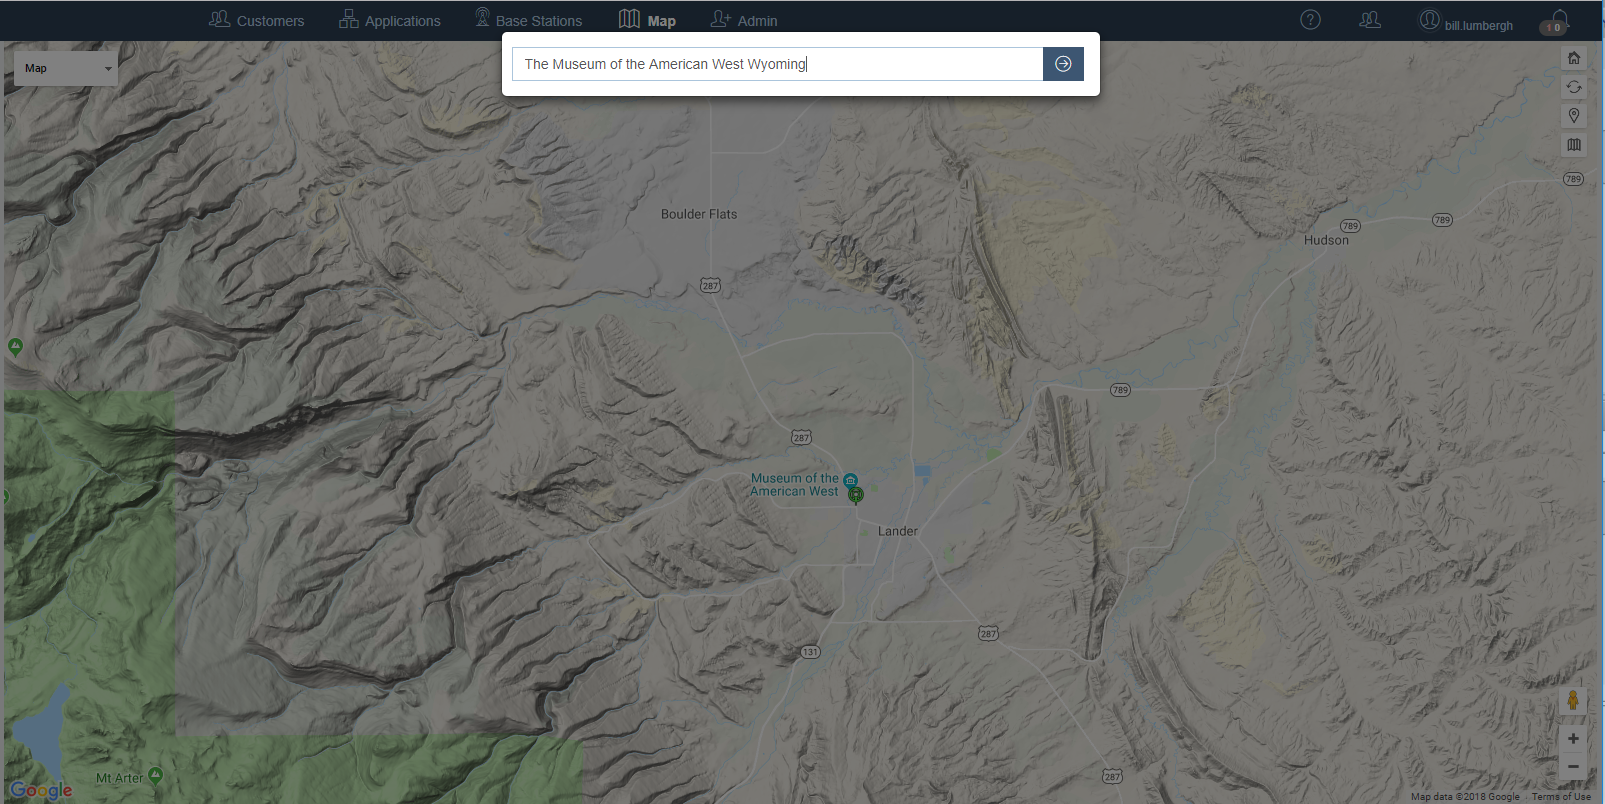
Once the search information is submitted by pressing the enter key or clicking the  icon, the map shows a pin for the location and the estimated path quality to nearby Base Stations (See Path Quality below). The green areas on the map reflect areas of high quality radio reception.
Right-clicking on an empty area of the map provides a short cut for checking coverage. This creates a pin at the clicked location and opens the Location Information dialog. Selecting the Path Quality tab shows the estimated path quality to nearby Base Stations (See Path Quality below).
Coverage Layer
The Coverage Layer is designed to display predicted network coverage of Base Stations within a given area. The layer is comprised of all viewsheds corresponding to the Base Stations within the Map's viewport, and presented as green image overlays.
This layer is only enabled at zoom level 9 and higher and may require zooming in to view coverage, as dynamically indicated by the Map Layers icon:
 - Available
 - Unavailable
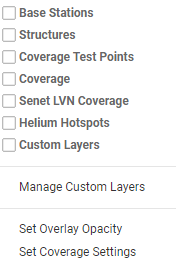
Once available, activate the Coverage Layer by first clicking the 'Map Layers' button, and then checking the 'Coverage' option.
When changes in either the location focus of the Map viewport or the zoom level are detected, a refresh is required to update the Coverage Layer's presentation, as indicated by a yellow emphasis outline and motion (not shown) of the 'Refresh Map' button:
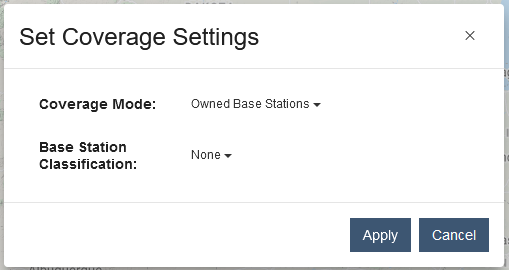
The Coverage Layer supports the current coverage settings for path quality. These can be configured from the "Set Coverage Settings" option seen above. This allows configuration of a Base Station Classification filter and the current coverage mode. This will limit the Base Station coverage shown to only Base Stations with that classification and those based on the coverage mode being used.
The Coverage Layer's opacity can be adjusted via the 'Set Overlay Opacity' option from the menu shown above.
Senet LVN Coverage and Helium Hotspot Layers
Two additional coverage layers are also available to visualize broader regional coverage, the Senet LVN Coverage layer and the Helium Hotpots layer.
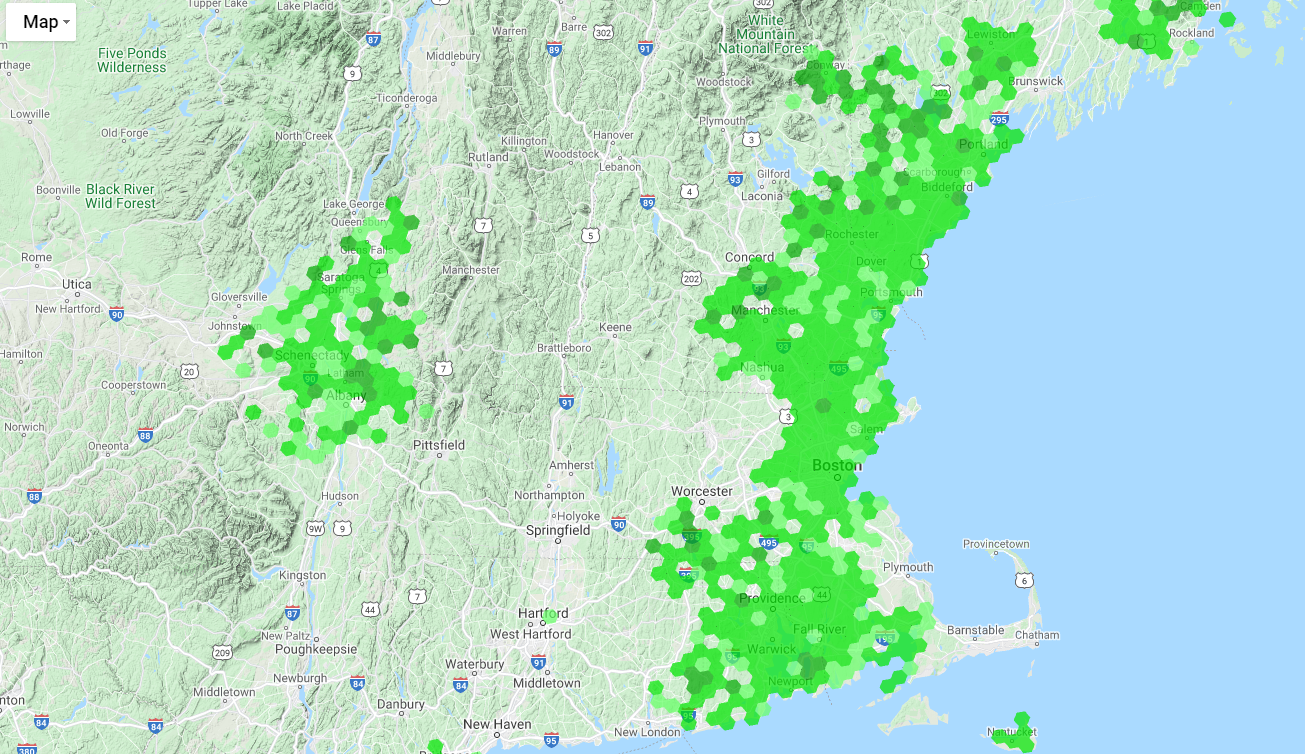
Senet LVN Coverage Layer
The Senet LVN Coverage layer shows the aggregate coverage provided by all Base Stations participating in the Senet LVN. Covered areas are presented as green hexagons based on Path Quality colored according to the following table:
| Coverage Level | Color | Path Quality |
|---|---|---|
| Excellent | Dark Green | Path Quality to hexagon's center point > 75% |
| Good | Green | Path Quality to hexagon's center point > 25% and <= 75% |
| Partial | Light | Path Quality to hexagon's center point <= 25% |
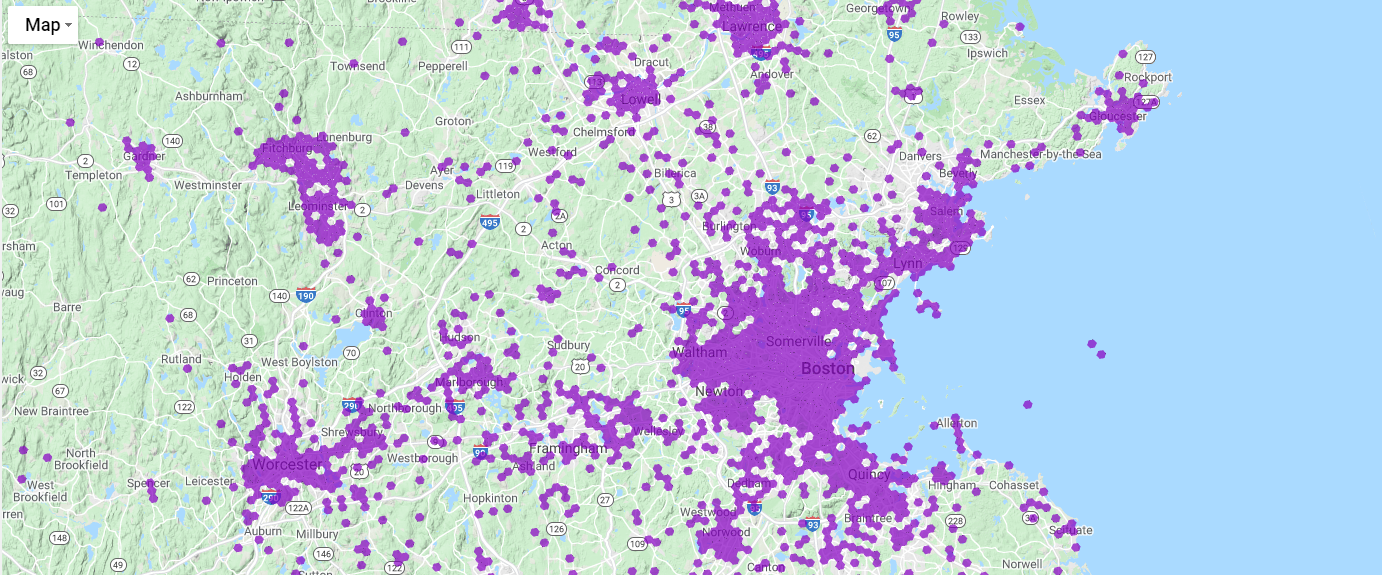
Helium Hotspots Layer
The Helium Hotspots layer shows the location of known Helium Hotspots on the Map as purple hexagons. Each hexagon may include one or more Helium Hotspots within the displayed region. Path Quality calculations have the option to include Helium Extended coverage for determining whether an area is covered by the Helium Network.
Path Quality
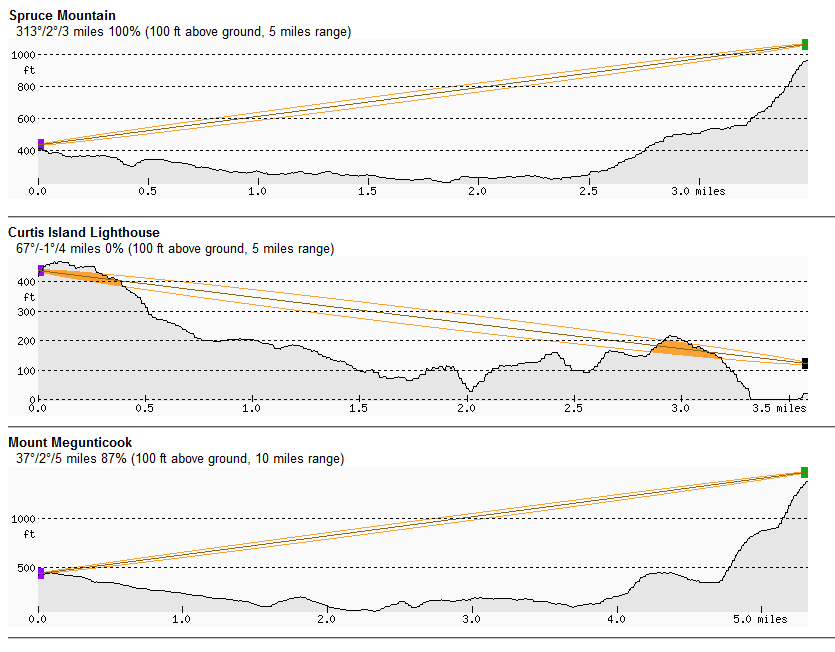
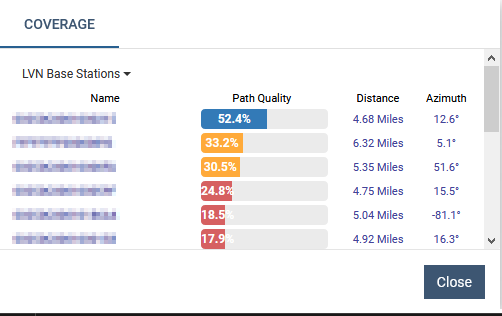
The path quality dialog shown in the lower left of the map after clicking on the map or executing a Coverage search, shows detailed information about the distance between the search location and the Base Station and reception quality expressed as a percentage. This percentage reflects the Fresnel clearance (line of site) between two points. This calculation uses an elevation database to determine how obstructions interfere with the line of site. Note: The zoom level of the map can be adjusted after the search to view the results with a different perspective. This may be required to see in-range Base Stations that are outside of the initial result view.
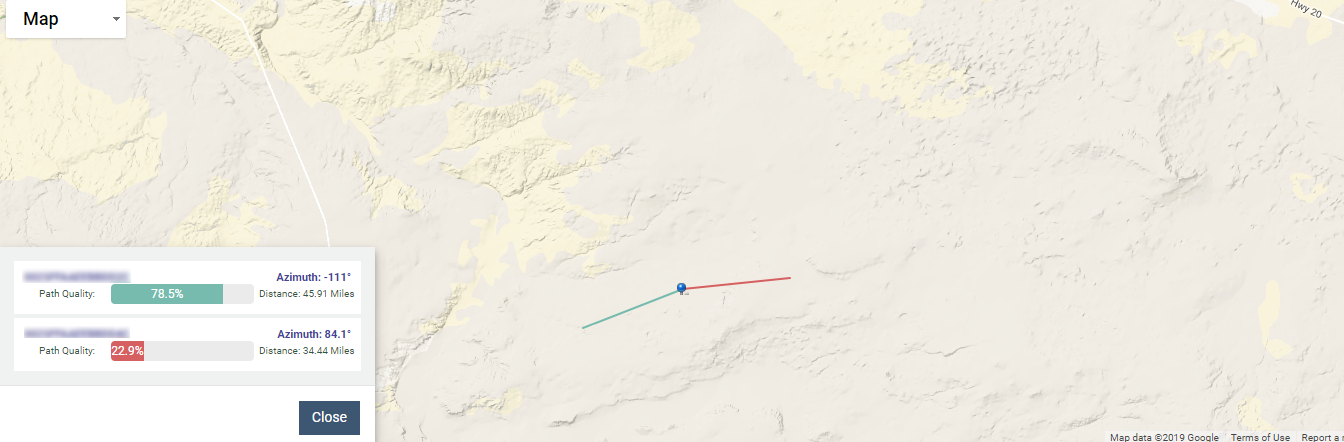
The pin plot for the selected location will also display a vector to each Base Station indicating the direction of coverage.
The following are different examples of line of sight path quality calculations:
And this is how the path quality results are displayed in the map:
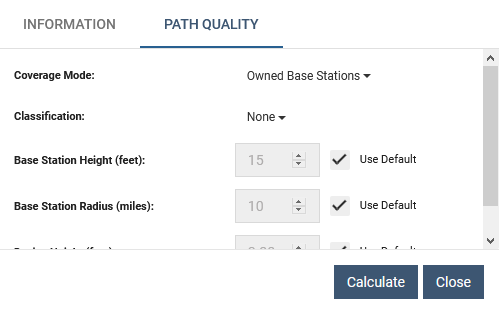
Path Quality Settings
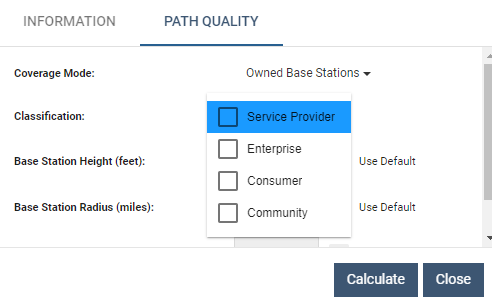
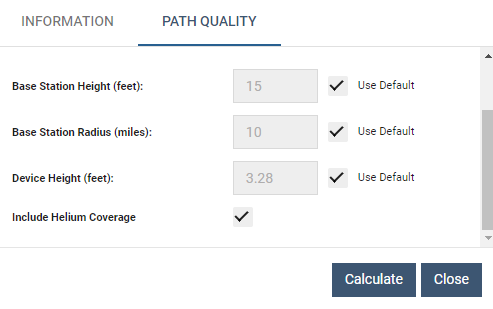
Netmore provides the ability to configure how path quality is calculated by allowing override of key inputs as well as control over which type of Base Station it is calculated for. Inputs overrides include Base Station height (feet) and radius (miles) , Device height (feet) and whether or not to include Helium Extended coverage. The Classification filter constrains which types of Base Stations the calculation is performed for. Customized settings are persisted across calculations to ensure a consistent planning experience.
Multiple Classifications
Include Helium Coverage
Path Quality Results
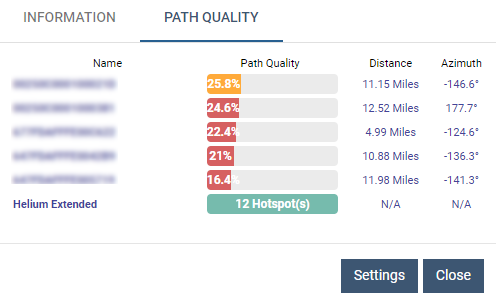
Note
Path Quality will include a count of the nearby Helium hotspots within range of the target location. Hotspot name, distance, and azimuth information are not included, because this is an aggregate count and not attributed to just one hotspot.
Path Quality Marker Colors
Path Quality Markers are generated for Planning Map entries that do not have a pre-defined marker. The markers are generated if the Calculate Path Quality check-box is selected during map creation or initiating a path quality calculation from the table.
| Color | Meaning |
|---|---|
|
No coverage or path quality not calculated |
|
Senet path quality between 0% and 25% |
|
Senet path quality between 25% and 50% |
|
Senet path quality between 50% and 75% |
|
Senet path quality between 75% and 100% |
If Helium hotspots are included in the Path Quality calculations, the generated markers include a purple dot as shown here:
| Color | Meaning |
|---|---|
 |
Senet path quality between 0% and 25%; Helium Hotspot(s) present |
 |
Senet path quality between 25% and 50%; Helium Hotspot(s) present |
 |
Senet path quality between 50% and 75%; Helium Hotspot(s) present |
 |
Senet path quality between 75% and 100%; Helium Hotspot(s) present |
 |
No Senet coverage; Helium Hotspot(s) present |
LVN Base Station Filtering
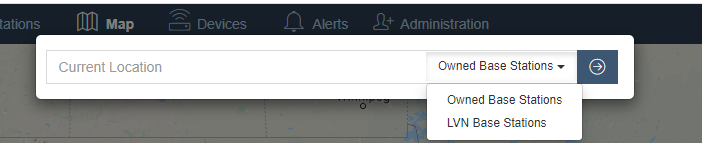
Both Coverage and Path Quality support optionally filtering the displayed Base Stations to those that are privately or publicly owned. Netmore Support must enable this feature to access it. When enabled, a selection control appears in the Coverage Search and Path Quality interfaces. This control filters displayed Base Stations or Base Station data to either Owned Base Stations (private) or LVN Base Stations (public). Any owned Base Stations that are not a part of the LVN, will not be visible if the LVN filter is applied.
Coverage Tool
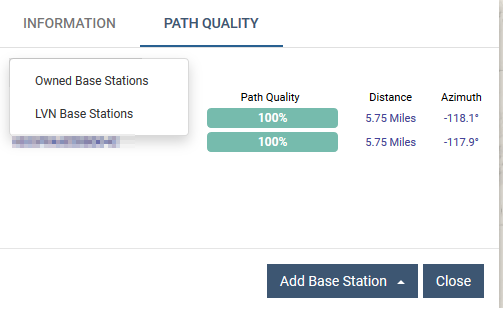
Path Quality
This is the Path Quality dialog shown by right-clicking anywhere on the map:
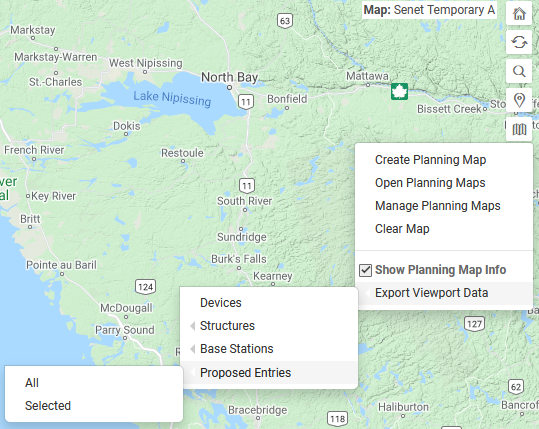
Proposed Entries Export
The Proposed Entries menu item provides options to export the proposed Base Stations within a planning map. Clicking the "All" option exports all proposed Base Stations. Clicking the "Selected" option exports the proposed Base Stations with displayed Viewsheds. This option is only available when a planning map is open and exports a file similar in format to the Base Station export.
Export Format
| Column | Description |
|---|---|
| Site Id | The ID of the Base Station Site |
| Viewshed Name | The identifier for the proposed entry either the address entered at import or the description |
| Project | The project associated with the proposed entry |
| Company | The company associated with the proposed entry |
| Latitude | The Latitude of the proposed entry's geographic location in decimal degrees |
| Longitude | The Longitude of the proposed entry's geographic location in decimal degrees |
| Radius | The radius of the proposed entry's viewshed in miles |
| Viewshed ID | The ID of the proposed entry, this is the insert index into the planning map |
| Status | The deployment status of the proposed entry, this is always set to Exploring |
| Date Created | The date the proposed entry was added to the planning map |
| Unavailable Date | The date the proposed entry was marked as unavailable |
| Northeast Latitude | The Latitude of the northeastern corner of the area that the proposed entry covers, this is always 0 for proposed entries. |
| Northeast Longitude | The Longitude of the northeastern corner of the area that the proposed entry covers, this is always 0 for proposed entries. |
| Southwest Latitude | The Latitude of the southwestern corner of the area that the proposed entry covers, this is always 0 for proposed entries. |
| Southwest Longitude | The Longitude of the southwestern corner of the area that the proposed entry covers, this is always 0 for proposed entries. |
| Base Station | The EUI of the real Base Station associated with the proposed entry, this is always blank. |
| Notes | Notes included for the proposed entry, this is always blank. |
| Structure ID | The ID of the structure the proposed entry was created from. |
| Structure Height AGL (ft) | The height of the structure the proposed entry is associated with above ground level in feet. |